Preface: Explaining our market timing models
We maintain several market timing models, each with differing time horizons. The “
Ultimate Market Timing Model” is a long-term market timing model based on the research outlined in our post,
Building the ultimate market timing model. This model tends to generate only a handful of signals each decade.
The
Trend Asset Allocation Model is an asset allocation model that applies trend-following principles based on the inputs of global stock and commodity prices. This model has a shorter time horizon and tends to turn over about 4-6 times a year. The performance and full details of a model portfolio based on the out-of-sample signals of the Trend Model can be found
here.
My inner trader uses a
trading model, which is a blend of price momentum (is the Trend Model becoming more bullish, or bearish?) and overbought/oversold extremes (don’t buy if the trend is overbought, and vice versa). Subscribers receive real-time alerts of model changes, and a hypothetical trading record of the email alerts is updated weekly
here. The hypothetical trading record of the trading model of the real-time alerts that began in March 2016 is shown below.
The latest signals of each model are as follows:
- Ultimate market timing model: Sell equities
- Trend Model signal: Neutral
- Trading model: Neutral
Update schedule: I generally update model readings on my site on weekends. I am also on Twitter at @humblestudent and on Mastodon at @humblestudent@toot.community. Subscribers receive real-time alerts of trading model changes, and a hypothetical trading record of those email alerts is shown here.
Subscribers can access the latest signal in real time here.
Time for bonds to shine
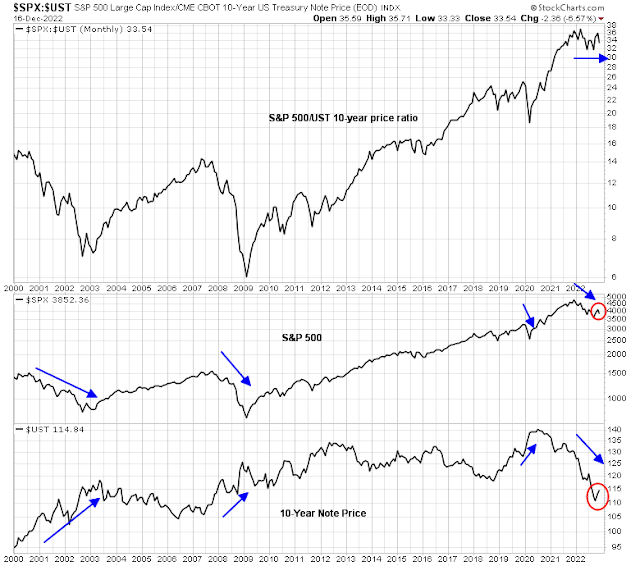
Last week, I highlighted how bond prices were reviving. The close positive correlation between stock and bond prices is breaking. This is the phase of the market cycle when recession fears grow, bond yields fall and bond prices rise, and the stock market weakens.
Deteriorating equity market internals
Over in the equity markets, technical internals are deteriorating. The S&P 500 pulled back at its 200 dma after exhibiting a negative RSI divergence and it’s testing its 50 dma.
Equity risk appetite indicators are also exhibiting minor negative divergences. Most troubling is the behavior of the speculative ARK Investment ETF, which violated relative support and continues to weaken.
From a longer-term perspective, the weekly chart of the S&P 500 shows that it’s violated g support while the stochastic is rolling over after reaching an overbought level.
Nearing downside targets
That said, my usually reliable S&P 500 Intermediate-Term Breadth Momentum Oscillator model (ITBM) is nearing its downside target, as defined by either the ITBM 14-day RSI reaching an oversold condition or the Zweig Breadth Thrust Indicator becoming oversold.
As well, don’t forget that the S&P 500 is inversely correlated to the USD. The USD broke down through support and remains weak, which should be a bullish sign for risk appetite.
In conclusion, the stock market is experiencing downside volatility of an unknown magnitude. The best harbor in this storm is default-free Treasury bonds, which is resuming its role as a risk-off asset.


Is TLT a good option or should we go for something shorter?
For what Cam is describing I believe TLT would be a decent choice.
Short bonds are influenced more by administered rates and should be anchored in anticipation of further, albeit smaller, rate hikes. Long bonds are influenced more by inflation expectations and should benefit from peaking/ declining inflation.
Charles Schwab is suggesting the ‘belly’ of the yield curve. It’s generally 5-10 year duration. IEF is a treasury 7-10 years bonds ETF.
Thank you all!
Intraday VIX model has flipped to the long side today 12/20/22, taking a trade by SPX futures ES at 3850 at 12:30 ET. The daily VIX model had already taken a long trade on open on Monday 12/19/22 at ES 3882.50.
https://toot.community/@ttmarket/109547433804455546
TLT and GLD heading the opposite direction. TLT has gapped down substantially 3 sessions in a row after hitting 108.5 support line turned resistance. Meanwhile GLD had no problem gapping up, gaining +1.71% today. A technical trader would have exited TLT at 105.66 on Monday 12/19/22 after the multiweek uptrend was broken consecutively.
https://toot.community/@ttmarket/109548766058957207