Preface: Explaining our market timing models
We maintain several market timing models, each with differing time horizons. The “Ultimate Market Timing Model” is a long-term market timing model based on the research outlined in our post, Building the ultimate market timing model. This model tends to generate only a handful of signals each decade.
The Trend Asset Allocation Model is an asset allocation model that applies trend-following principles based on the inputs of global stock and commodity prices. This model has a shorter time horizon and tends to turn over about 4-6 times a year. The performance and full details of a model portfolio based on the out-of-sample signals of the Trend Model can be found here.

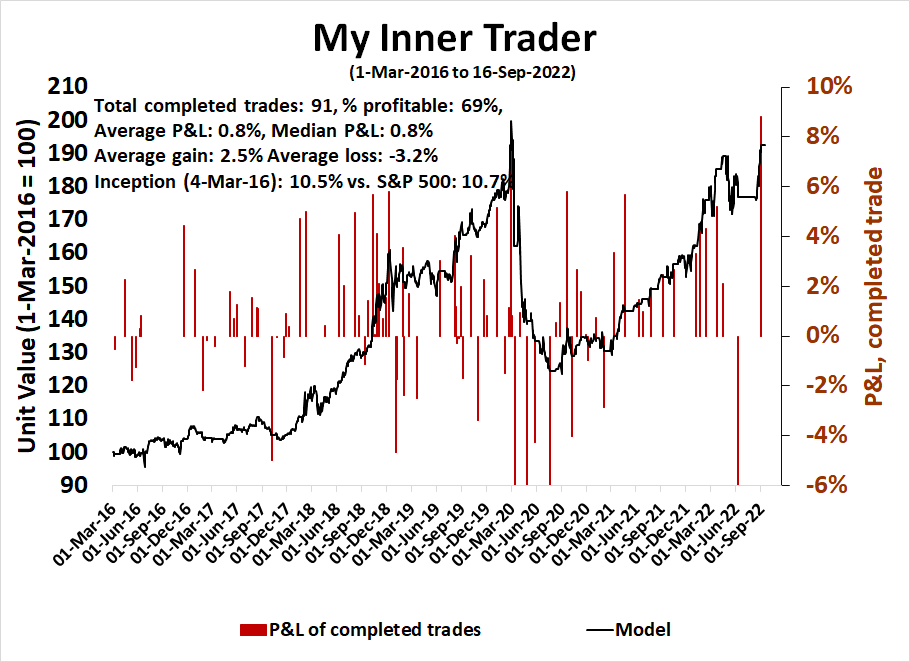
My inner trader uses a trading model, which is a blend of price momentum (is the Trend Model becoming more bullish, or bearish?) and overbought/oversold extremes (don’t buy if the trend is overbought, and vice versa). Subscribers receive real-time alerts of model changes, and a hypothetical trading record of the email alerts is updated weekly here. The hypothetical trading record of the trading model of the real-time alerts that began in March 2016 is shown below.
The latest signals of each model are as follows:
- Ultimate market timing model: Sell equities
- Trend Model signal: Neutral
- Trading model: Neutral
Update schedule: I generally update model readings on my site on weekends and tweet mid-week observations at @humblestudent. Subscribers receive real-time alerts of trading model changes, and a hypothetical trading record of those email alerts is shown here.
Subscribers can access the latest signal in real time here.
Waiting for the FOMC
As investors look ahead to the FOMC meeting next week, rates are rising and the 2s10s yield curve is inverting further. The 10-year to 3-month spread is not inverted yet, but it likely will once the Fed raises rates.

It’s difficult to make definitive bull or bear views on equities and bonds as there is much policy uncertainty. Here is what I am watching:
- The Fed has given the obligatory nod to a “soft landing” but what’s the body language about a possible recession?
- The Fed has said higher for longer, but how much longer?
- What are its inflation projections for 2022, 2023, and 2024 in the Summary of Economic Projections (SEP)?
- How far does the dot plot get revised up, and what is the terminal rate?
The small business barometer
As we are in the blackout period for Fed officials ahead of the FOMC meeting, investors are left to speculate on the likely direction of Fed policy. Here are some clues from the most recent NFIB small business survey. The survey is especially useful since small businesses are sensitive economic barometers because they lack bargaining power. The NFIB survey had some good news on inflation. The pace of price increases is rapidly decelerating, which is good news.

The bad news is that small business optimism edged up, which is a curious reading during a midterm election year. Small business owners tend to tilt small-c conservative and Republican. Normally, small business optimism is depressed when the Democrats control the White House and both the Senate and House. The small increase in optimism is a signal that the economy is robust in the face of recession fears which leaves room for the Fed to raise rates without too many recession worries.

Signs of technical weakness
What does that mean for the stock market? Technical indicators all suggest that the path of least resistance is down, at least for the short term. First, we are seeing trend line violations across all market cap bands.

As the S&P 500 broke down to a lower low, breadth indicators have confirmed the weakness by also showing lower lows.

The NYSE McClellan Summation Index (NYSI) has been falling and stochastics are not oversold yet, indicating further downside potential in the near term.

The NYSE McClellan Oscillator rebounded from an extreme oversold reading and it is weakening again, which is an indication that the market could fall further if the bears control the tape.

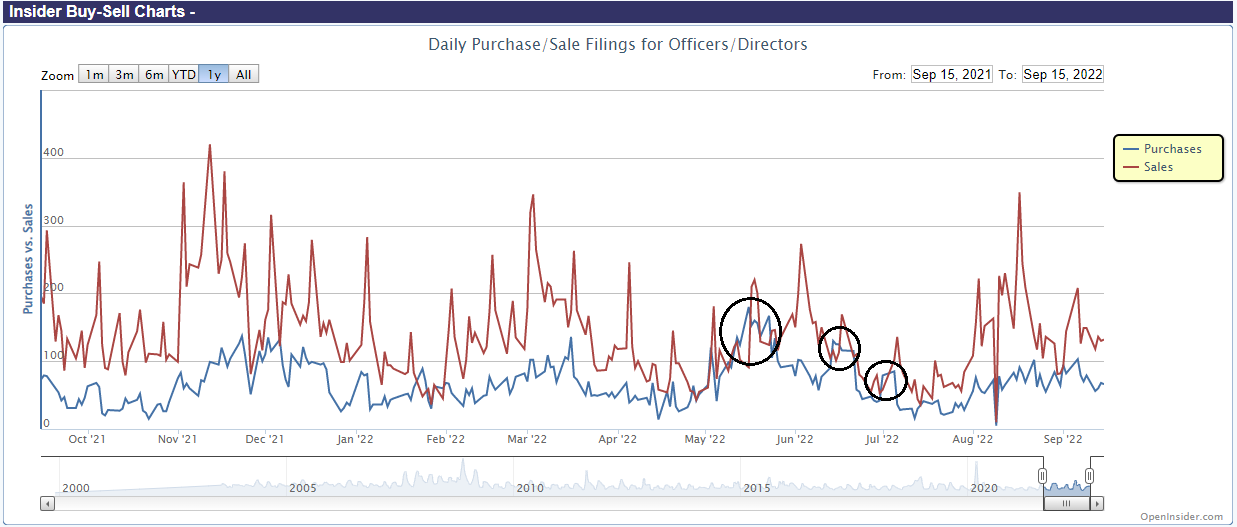
Equally disturbing is the lack of insider buying as stock prices weakened.
Beware of reversals
Ahead of a possible market-moving event like an FOMC meeting, it’s difficult to make a call on market direction beyond the event. Investors and traders risk falling into a possible price reversal trap. The stock market has followed an FOMC pattern in 2022, where stock prices fall and bottom just ahead of the FOMC meeting and rally afterward, which is an indication that positioning becomes overly hawkish and bearish and snaps back.

Ryan Detrick calculated the daily seasonality for the S&P 500, and we are entering a period of negative seasonality and reversal that roughly coincides with the FOMC meeting cycle.

The market saw a big drop in stock prices in reaction to the hot CPI print. SentimenTrader observed that every single stock in the NASDAQ 100 fell that day, which is rare. A historical study shows that the median one-week return is 0.3%, but the median two-week return is 4.1%. Unless the market melts up on Monday, the first week will be negative, but if history is any guide, the following week should be strongly positive.

In conclusion, it’s difficult to make definitive calls on market direction ahead of an FOMC meeting. Price momentum is negative in the wake of the hot CPI report and I would expect it to continue into the date of the meeting. However, investors need to be prepared for a possible reversal should sentiment and positioning become excessively bearish and hawkish.
Explanations are often things we do to explain what we don’t understand. Sometimes they are probably right and sometimes are just air.
It’s funny if they are so hawkish at the Fed do we get a surprise? You know when everyone thinks the same, something else happens. I expect rates to go up this week, but I don’t know what will get the Fed to pivot or when…no clue.
The talk about inflation becoming self reinforcing sounds akin to consumer FOMO, which in some cases must be true. In the 70s, us boomers got credit cards which were newish and increased money and also made it easier to pursue our FOMOs. So my thinking is that just like we get FOMO in the market when it has been going up like crazy the same will apply to inflation and if it is disinflation then FOMO won’t happen except for OCD types like me. Think toilet paper…if we knew the price would go up 10 % would the shelves be bare? I think it was more along the lines of get some while you can.
Remember that they fudge the inflation numbers, heuristics and all that, we have had inflation going on for years.
What worries me the most is energy. This is a supply side inflation and are we entering an era of energy shortage, you can’t make anything without power in a modern economy. If the cost of power goes up the cost of making things barring some major technical changes eg robots replacing humans at say 1/3 the operating costs, then inflation is held at bay for a while. Robots are not there yet, and big oil is spending less on Capex which makes me worry about 5 or 10 years down the road, but maybe SMRs will fill the gap until fusion is commercially viable, but we could also be in for really expensive oil.
I wish I was smart enough to learn from what is going on in Europe but I’m not. Still the next year or 2 of Europe struggling through an energy crisis should be instructive.
Alexander Stahel has some great twitter threads on the European energy situation, he just updated his expectations for the 2023 situation with regards to natural gas, quote: “In a previous thread I argued we can (import the needed gas flows via LG) but I changed my mind. The issue is that Europe will likely struggle to contract >185bcm LNG even at sky-high TTF/NBP prices (necessary but insufficient condition).”
LNG (not LG) – I was starting to get more constructive on Europe given better than expected gas stockpiles, but 2023 is looking more and more challenging.
I’ve noted for several years that I would be happy with any instrument able to match the guaranteed 5% return on the company pension plan.
I plan to allocate a significant portion of cash into one or more 1-year fixed income instrument(s) – either a CD or a T-bill next week. 3.9% to 4% is a long way from 5% – but also a long way from where rates were a year ago.
I was expecting to see a downgrade of Trend Model to Sell equities based on the post yesterday and earlier recommendation of going long ZROS.
I characterize the short term as fear of whiplash. I also think that the call of The Bottom of June lows maybe premature.
JPMorgan thinks that Core Fixed Income has limited downside and may provide capital gains thus acting as a ballast.
On the ES mini we had a hammer, and RSI might diverge, if we get a bounce…but I would watch any bounce for a chance to buy SPXS or a similar etf…only ? is when will the bounce be done?
I confess to having a bearish bias.
Look at Crescent research, they say we have been in a bear since 2000…they base it on P/E ratios…in a nutshell bears give low returns, as do times when P/Es are high, bulls start only when P/Es are low…it’s a different way of looking at things. What we have right now is a “hibernating” bear.
Cresmont
not Crescent…damn spellcheck
I agree but trend following models are maddenly slow to react to trend changes.
FedEx has to be a wakeup call. How can it not be? The economy, corporate earnings and stocks prices are at risk on an intermediate basis until the Fed pivots. That pivot looks far away.
This severe outlook is great for traders because the swings in a bear market are always huge until we hit bottom. Just make sure you zig and zag at the right time or you will lose big.
Fedex is a tell on economic weakness of China and Europe. Strong dollar does not help. UPS by contrast is more domestic and a tell on US economy. UPS fell half as much as Fedex in last five days.
Worrisome sign nonetheless.
Brokered CDs – ie, CDs offered via brokerage firms – offer two advantages.
(a) Within a single account, it’s possible to purchase CDs from multiple banks, effectively expanding your FDIC protection beyond $250k.
(b) Brokered CDs can be traded on the secondary market. In the event of a market crash, it’s possible to sell the CDs and reinvest the funds into the stock market.
I meant to say ‘it’s possible to sell the CDs prior to maturity and reinvest the funds into the stock market.’
Bank CD’s may also be canceled with some interest penalty. Advantage is possible 250k insurance and ease of management with brokered CDs. Mho
Regarding sentimenTrader’s historical study. While it showed a 62% overall “win rate” by the 2nd month, given the first week is going to be negative this time, the conditional win rate is then down to 33%, and the conditional median return being about -5%.
SPX futures ES has now breached its price resistance at 3923 and appears to be holding. The breadth momentum strategy had bought into the rally ahead of price movement at 3878 at 11:36 earlier today because of the sufficient gains in breadth. The breadth model however has not changed in the daily timescale and is still short and offers a price resistance at 4030. About two weeks ago back on 9/2/22, ES tested upper resistance and briefly broke through to ES 4036 then sold off and retested the bottom near the same level at 3922 that is being tested now.
https://i.imgur.com/6jsPHMw.png
4% notes/CDs sound boring…except against the backdrop of extended declines in the market.
When $SPX closes at a 5-day low and below the 200ma just before a Fed Day Posted on September 20, 2022 by Rob Hanna. SPX would need to close below 3873 today in order to trigger this setup. If SPX rise too fast today above 3873, it will likely sell off.
https://quantifiableedges.com/when-spx-closes-at-a-5-day-low-and-below-the-200ma-just-before-a-fed-day/
An inverted chart of $SPX suggests a channel and target that is equivalent to near the mid July, 2022 low ~3761. But that may come after the Fed day release on Wednesday which have been positive days (>+1.4%) for 4 out of 4 releases so far in 2022, however not all positive return carried over to the days after releases.
https://i.imgur.com/76C5fS5.png
I think Rob Hanna also generally notes that if you’re going to take the setup, he recommends closing the position prior to the actual Fed announcement, as most of any gains will be realized before 2 pm.
Thank you. The record for 2022 is that: ‘ For example, on March 16, the S&P 500 rallied by more than 1.5% after 2:30 PM. Then at the May meeting, the S&P 500 rallied by more than 2% after 2:30 PM.
Then on June 15, the S&P 500 rallied around 2% after 2:30 PM. Finally, on July 27, the S&P 500 rallied by more than 1.5% after 2:30 PM.’
https://seekingalpha.com/article/4542090-stocks-may-rally-regardless-of-what-the-fed-says?
Right. As with all potential pattern changes we need to decide whether it now reverts back to historical tendencies. There have been many anomalies in 2022. Will that continue to be the case? We’ll find out today what the market deems to be maximum frustration.
It never is a good sign when the market breadth model says to reverse course and sellshort in the middle of a Fed day rally, even before the rally has fully begun. Sellshort at 14:34 ES (SPX futures) 3866.25. Even though ES managed to rally 2.36% from its 14:00 lows, it lost all of it and more by closing. The bulls will have to reevaluate its thesis from this point given that the RCD/RHS positioning has also reversed in the weekly chart should it close the week today. There may be a little bit of time for the bulls to show up, but the probability of that is dropping everyday.
https://i.imgur.com/1gueQug.png
SPX closed at 3789.93 -1.71%. The inverted chart of SPX is now approaching its upper channel target of ~3761 which is near to the SPX mid July low. Sometimes these are points for a rally and reversal.
https://i.imgur.com/TtYQNGf.png
Marty Zweig had it right. Don’t fight the Fed.