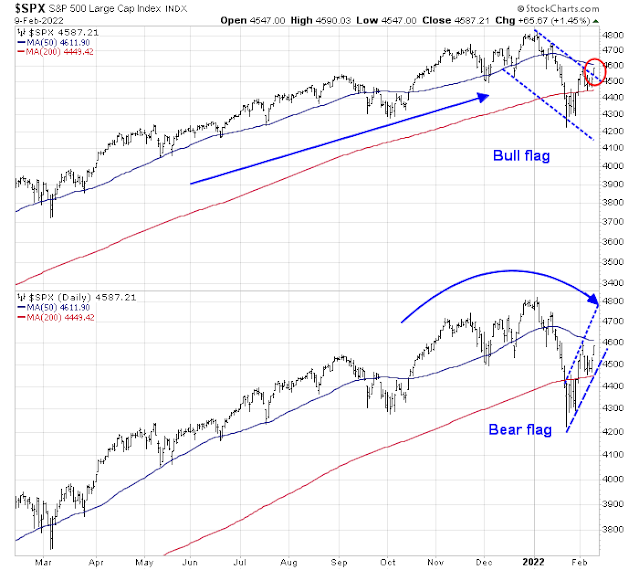
Mid-week market update: Technical analysis can be highly interpretative. Consider, for example, the bull or bear flag, which is a continuation pattern. For the uninitiated, a bull flag is a pullback within a bull trend and the trend is deemed to have continued when the stock or index stages an upside breakout from the flag. The reverse holds for a bear flag.
With that brief explanation in mind, did the S&P 500 just break out of a bull flag, or is it still tracing out bear flag?
Bullishness and bearishness are in the eyes of the beholder.
Waiting for a sentiment reset
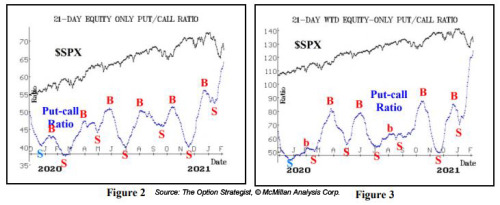
The principal reason for the bull case is the lack of a sentiment reset. Sentiment remains overly bearish. Jeff Hirsch at Alamanac Trader recently wrote, “Sentiment looks like it’s getting negative enough to support a rally”. He cited the skyrocketing put/call ratio and the overall bearish tone from Investors Intelligence as the reasoning for his bullishness.
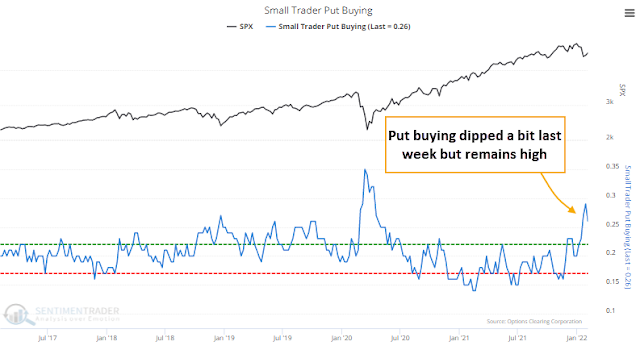
Jason Goepfert at SentimenTrader wrote that “Investors are hedging like it’s a repeat of the pandemic”. Small investor put buying had recently skyrocketed.
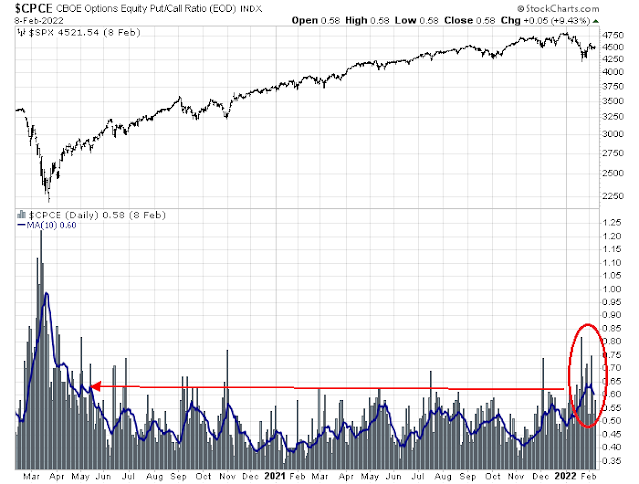
Indeed, the 10 dma of the equity put/call ratio is highly elevated and readings haven’t been this high since the days of the COVID Crash and recovery.
Similarly, JPMorgan’s strategist Mislav Matejka recently pointed out that the VIX Index had risen by over 50% of its 1-month moving average on January 25, 2022. The indicator has proven to be 100% accurate outside of recessions over the last three decades.

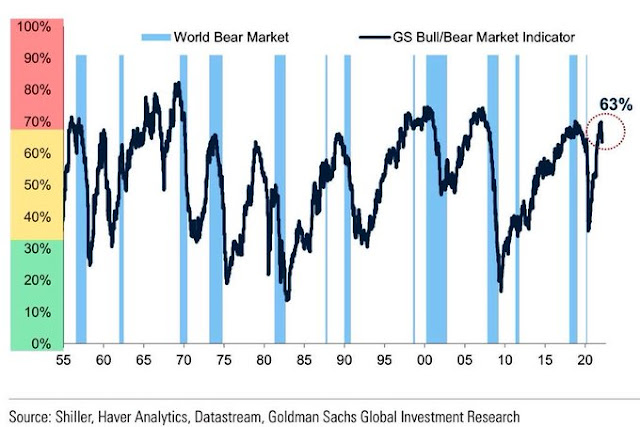
Intermediate-term bearish
On the other hand, Goldman Sachs bull/bear indicator is at or near bear market territory. This is an intermediate-term bearish signal.
Tactically, tomorrow’s CPI report could be a bearish trigger. In a briefing today, White House Press Secretary Jen Psaki warned of “a high yearly inflation reading in tomorrow’s data”,
To be sure, the BLS annual CPI basket revision could be a source of volatility. The changes are based on consumer expenditure data from 2019-2020, which raised the weight of goods and reduced the weight of services. As an example, during the pandemic, households mostly avoided restaurants, which depressed the weight of the “food away from home” basket (service), and ate at home, which boosted the weight of “food at home” basket (goods). Consensus estimates peg the changes as boosting annual headline CPI by 0.2%.
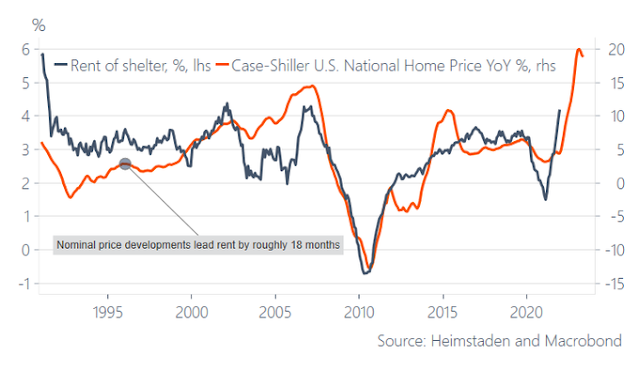
The most worrisome factor for investors is a hot Owners Equivalent Rent (OEF) print, which comprises roughly 40% of core CPI. While OER has been relatively stable, leading indications from housing prices are likely to put upward pressure on OER, core CPI, and spook the financial markets in the near future.
Bull flag, bear flag
How should traders interpret current conditions? Did the S&P 500 trace out a bull flag breakout or is it still in a bear flag pattern?
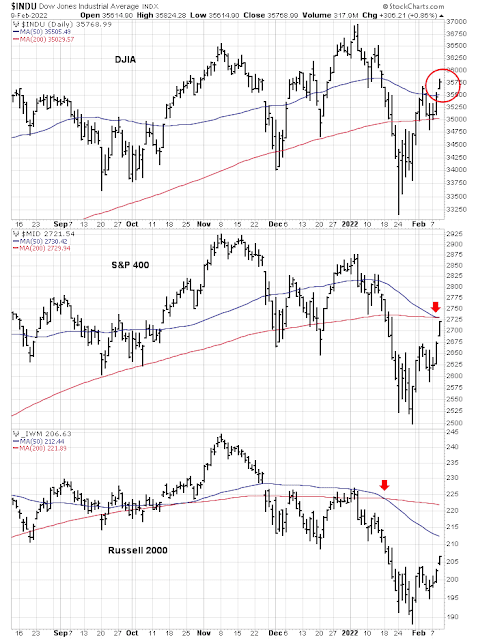
Instead of fretting over bull and bear flags, I interpret the S&P 500 as being caught between 50 dma resistance and 200 dma support. The analysis of other major market averages presents a mixed picture. While the Dow has staged an upside breakout through its 50 dma, both mid and small-cap indices are below their respective 50 and 200 dma. Moreover, they have either undergone or about to undergo bearish dark crosses of these moving averages.
My inner investor is neutrally positioned at about his investment policy stock and bond targets. Subscribes received an email alert that my inner trader had taken profits in his long S&P 500 position and stepped to the sidelines ahead of tomorrow’s CPI report. He may be inclined to re-enter on the long side should the market experience a bearish shock from a hot CPI print.
When it comes to Technical Analysis being interpretative I think it comes down to the “quality” of the signals a lot.
Just the fact that you can “interpret” this data in 2 different ways highlights to me that both the signals are of poor quality if they are signals at all.
To me for the data to be a good bear or bull flag means that nearly all the data points should fit neatly within the two parallel lines. In the examples above I don’t think they do.
I think a good example of a bull flag was the decline in December in the S&P500. Here the data nicely fits 2 downward sloping parallel lines especially if you look at the 15min data.
Trading Rules
There are certain averages that have withstood both Bull and Bear Markets for a long period of time. Of course, they are not infallible but in most times will keep you on the right side of the trend.
1. Stocks, Indices, or commodities trading below their 200 day moving average. Long term trend down. More Bearish if 50 day average trading below 200 Day average.
2. Intermediate trend down when 20 Day moving average is below the 50 Day moving average.
3. Short term trend up or down defined by the 10 Day moving average.
The probabilities of success increase if you trade the intermediate trend. Therefore based on that criteria you would buy all dips as long as the intermediate trend is up and short rallies if the intermediate trend is down.
So where are we now:*
NDX (qqq):
Below 200 Day Moving Average – Bearish and below 20 Day Moving Average
Below 20 Day Below 50 Day Moving Average i.e. Intermediate term Bearish
Above 10 Day moving average i.e. short term Bullish
One thing to keep in mind is that I am a trend momentum trader. So what works for me is not the “only way to skin a cat”. I do not try to bottom fish. This month I have mostly traded from the short side, with success. I lost money on the only long trade I made. Traded gold from the long side with success.
* For a broader view of the market one can use the N.Y. Composite or the Value Line Index.
I believe the seasonality calendar for February supports the case for a rally this week followed by a decline into mid-month – then followed by an even stronger rally.
Ultimately, is anyone able to consistently predict market movements?
David Hunter is an interesting guy who likes to make bold forecasts:
https://twitter.com/DaveHcontrarian/status/1491391662220005378
He’s calling for a 30% to 40% rally – followed by a -70% to -80% decline. He also called for a steep decline last October – so in broad terms, you could say he was proven right in January.
Mark Hulbert predicted a ST rally on January 20. He missed the SPX lows by about 200 points, but again you could say he was generally correct (thus far).
https://www.marketwatch.com/story/a-bullish-sign-nasdaq-investor-sentiment-is-worse-now-than-it-was-in-march-2020-11642705184
Cam, of course, nailed the last few moves. Which is why we’re all here!
Reopening positions in QQQ/ SPY on the negative reaction to CPI.
Adding to positions on further declines.
Basically, allowing prices to come in to my buy zone. Beats chasing higher every time.
Gap fill for SPY.
Ditto for QQQ.
We may see QQQ 355/ SPY 447 if bears regain control of the tape. On the other hand, we also a large number of short-sellers and underinvested bulls. Should be an interesting day.
As always, the question comes down to whether it’s a buying opp – or a selling opp.
I think it’s a buying opp.
In the back of my mind, there’s the thought that Dave Hunter – as prone as he is to exaggeration – and Mark Hulbert – as imperfect as his sentiment indicators are – might be on to something.
Maybe we’ve seen the ST lows and need to test the January highs before retesting the January lows.
If the bulls are able to turn the indexes green then we may be off to the races.
IWM green.
Here comes the mid-morning test.
Adding small on the retest.
Adding further to positions.
Incredible shakeouts. The kind that may (or may not!) precede reversals.
Now’s the time to ask myself if I’m in or out. I’m staying in.
Adding further on the reversal off the lows. It’s a gamble that SPX 4507 was enough to shake out most non-believers.
VIX has been >23 for the past hour…
Retesting 4507. Trimming positions, but only the ones opened ~1141.
Putting the positions referenced above back on.
So an undercut of 4507 to 4503 before reversing.
So an ugly close. What’s keeping me in?
(a) Red for the day, but still green for the week.
(b) The elevated VIX.
(c) Had I not opened positions earlier I would be opening now.
Of course – it would have worked out better had I sold the opening ramp in hopes of buying back earlier. But that’s water under the bridge. Trading happens in real time.
Traders have become pretty sophisticated. In order for a retest/ shakeout to be effective, this is the kind of action needed.
Bottom line->disappointed in the close but not discouraged. I like the relatively high volumes on SPY/ QQQ. Anyone that wanted out may be out.
Another positive->the CPI number is behind us.
I think we rally tomorrow.
Famous last words.
Wow! A hot CPI print.
Glad I sidestepped that landmine.
You have a perfect record over the past several weeks.
Is this a case where the market holds against bad news? Volume on the ESmini is good and price is holding above the neckline of that sloping H&S…a bullish sign? We didn’t get a Facebook faceplant on the CPI print, just a rapid drop with a sharp bounce, of course it could rip back down again.
Great call Cam! Spot on!
Whew! Advanced Notice of a Meeting under Expedited Procedures
Review and determination by the Board of Governors of the advance and discount rates to be charged by the Federal Reserve Banks.
https://www.federalreserve.gov/aboutthefed/boardmeetings/20220214closed.htm
Important? A similar meeting happened on Jan 18, 2022. May be nothing burger.
Well, they may raise rates , but what will the market do? If the market goes up they will say it was less than expected, or they will say it is because the economy is strong. If the market goes down they will blame the rate hike.
The Fed is trying to control the inmates of the asylums in Washington and on Wall Street, only they cannot, because they will keep doing what they do.
I still think we are getting too much negative press. The chart obviously is not at a major bottom or been declining for a long time, but they are selling a lot of puts and you’d think the world will end soon. Expect knee jerk reactions, but I am skeptical
Also, Nov 1 the 2 year yield was less than 0.5%, now it is 1.61%, in 2 1/2 months! So they will raise rates. But consider why rates go up for us ordinary people. If we all want to borrow (like boomers did in the 70s) well rates can go up because the banks can ask for more, but they can also ask for more if they don’t trust our credit.
In the housing bubble, they didn’t care about credit risk because the offloaded the debt as CDOs and MBS, but notice that they did not trumpet how this CDOs and stuff was crap but rated it triple AAA.
So we get half truths, we get told that past performance does not…yada yada.
This is why, aside from my nature that I think we are being set up with a bear trap…the bear will come eventually and if we go back to around 4200 we can get H&S talk with a target below 3600
Also remember that when the yield curve inverts is not when the fan gets nasty, it’s when it reverses the inversion
2s10s is now down to 0.42. Some nervous nellies might be prepared to front-run. Not a good situation. How can Fed solve supply chain and energy supply problems by rate hikes and QT? So the solution is enough demand destruction? Since the political pressure is so high the probabilities of policy errors are rising. Forget about being a little more patient.
Let’s see what housing market looks like going forward now that mortgage rates have gone up a lot.
Lowering exposure/ removing risk to some extent in the premarket session. A retest of the overnight lows in the ES is a 50/50 bet, which would allow me to reload at lower levels. On the other hand, an unexpected spike up is also a 50/50 bet, and I want to retain enough exposure to profit.
There is so much emphasis on inflation right now (in the media and at work) that ‘peak inflation’ might be either around the corner or already behind us.
Added back a little exposure.
OK.
I’m out. I need to preserve a green week.
I feel as if I hit a perfect pitch on Thursday for a solid line drive. Then I tried to steal a base and was taken down instead.
In the nick of time!
https://www.marketwatch.com/story/the-surprising-twist-in-what-rising-inflation-means-or-the-stock-market-11644517927?mod=mark-hulbert
We often overlook what’s otherwise obvious:
‘investors will incorrectly update their stock-market valuations in the wake of higher inflation and interest rates. They will, quite properly, discount future years’ earnings at a higher rate, with the result that the present value of those future earnings is lowered. But that’s only half the equation. They fail to recognize that, when inflation is higher, future years’ earnings tend to grow faster than they would have otherwise.
‘These two effects of higher inflation and interest rates at least somewhat cancel each other out. Nominal earnings will be higher, but they must be discounted at a greater rate back to present value. Inflation and money illusion is recognizing the second of these two consequences but not the first.
‘The bottom line? Higher inflation and interest rates are not necessarily the threat to the bull market that most assume that they are.’
I agree. Just some stocks will perform better than others under an inflationary environment
TLT rising from the lows on high volume.
Safety trade, or an oversold bounce off negative sentiment?
Still a long way from the January 24 lows – not sure we get there on this decline. SPY did at one point undercut the January 31 low, however.
Will likely close at the lows with as selling accelerates.
That Hunter guy isn’t worried.
https://twitter.com/DaveHcontrarian/status/1492148693511909376
Is Gold telling us that the market doesn‘t really believe in the Fed‘s Hawkishness? Or maybe that what they are willing to do won‘t be enough. Kuroda already told us what he is going to do – the ECB is just talk no walk here, hugely reluctant to raise, but talking about it. Even with recent trouble in high yield spreads still look tame.
Taking losses quickly. The one rule I adhere to better than any other.
I am admittedly a guy who almost always takes profits too quickly. The flip side, however, is that I take losses just as quickly if not more so. And days like today are when it pays off well. Given a choice between a higher portfolio balance at SPX 4504 (last night’s close) and a somewhat lower portfolio balance at SPX 4419 (tonight’s close), it’s a no-brainer. I now have the opportunity to trade for gains several times the size of today’s loss on the way back up.
Scaling back into a little SPY/ QQQ after hours. 2-day selloffs of -4% to -5% are pretty brutal pullbacks. Could gap down even further on Monday so sizing down.