Mid-week market update: I could tell that a panic bottom was near on Monday when how many people had lost their minds when the S&P 500 fell -3.7% from its intraday all-time high, both from my social media feed and emails (see A sudden risk-off panic). The S&P 500 rallied impressively on Tuesday to fill Monday’s downside gap, and today’s follow-up was equally constructive.
Despite the market’s recovery, the bulls aren’t out of the woods and downside risks remain. Here’s why.
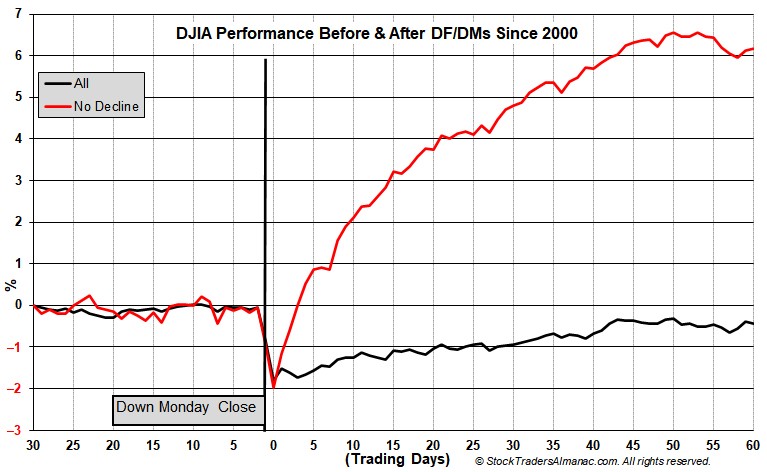
Down Friday and Mondays
Jeff Hirsch posted a
LinkedIn article entitled “DJIA Down Friday/Down Monday: Historically an Ominous Warning” tells the story. The historical record underlines the downside risks to the stock market.
Since January 1, 2000 through todays close there have been 221 DJIA Down Friday/Down Mondays (DF/DM) including todays. From DJIA’s closing high within the next 7 calendar days to its closing low in the following 90 calendar days, DJIA has declined 212 times with an average loss of 7.21%. Declines following the DF/DM were greater in bear market years and milder in bull market years (see page 76 of Stock Trader’s Almanac 2021). The eight times when DJIA did not decline within 90 calendar days after were following DF/DMs on October 7, 2002; May 19, 2003; November 17, 2003; February 3, 2014; October 13, 2014; October 31, 2016; September 25, 2017 and October 9, 2017.
Hirsch believes the market action in the next few days will yield greater clarity to the market’s intermediate-term direction.
Based upon the above chart, if DJIA recovers its recent losses within about 4-7 trading days, then the DF/DM that just occurred may have been the majority of the decline. However, if DJIA is at about the same level or lower than now after this window, additional losses are more likely over the next 90 calendar days.
What to watch
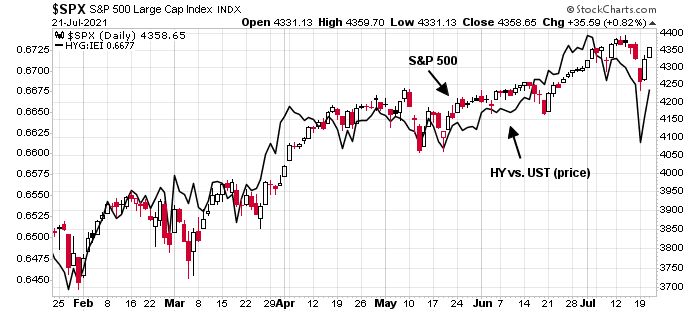
Here is what I am keeping an eye on. The fright hasn’t fully receded from the bond and currency markets. The 10-year Treasury yield fell as far as 1.13% on Monday. While it has recovered, it is still in a downtrend, indicating market caution. As well, the USD is a safe haven currency and it is still advancing. These two cross-asset signals represent the most worrisome indicators from a risk appetite perspective.
Credit market risk appetite is also mildly concerning. The relative price performance of junk bonds to their duration-equivalent Treasuries is flashing a minor negative divergence against the S&P 500. These minor divergences have occurred in the past and they are not actionable signals by themselves. When paired with heightened risk levels, however, this divergence is something that should be monitored.
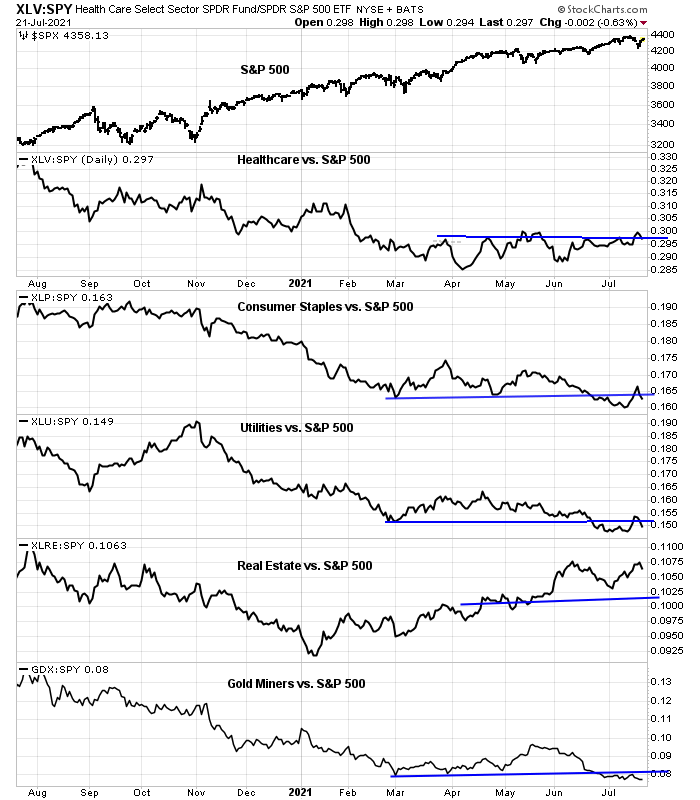
Defensive sectors of the market staged brief upside relative breakouts on Monday but retreated to test their breakouts. If the bears are to seize control of the tape, these sectors must regain and maintain their breakout levels.
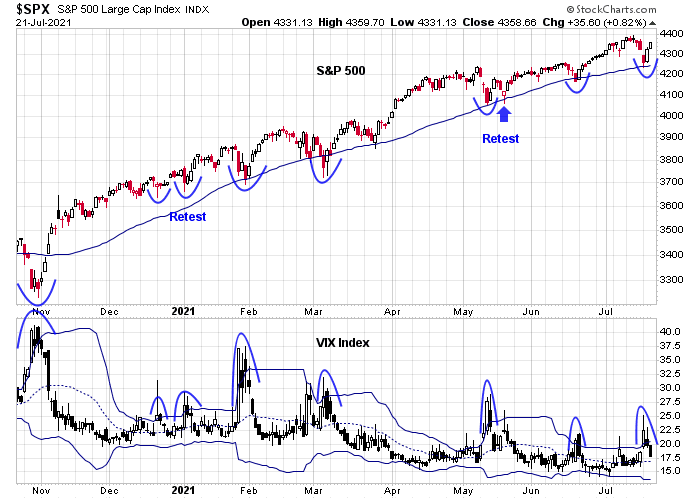
The VIX Index rose above its upper Bollinger Band on Monday, which is the signal of an oversold market, and recycled below its upper BB. The S&P 500 duly rallied as a result. However, this condition does not preclude a retest or even an undercut of Monday’s lows. If the past is any guide, any market weakness will begin after the VIX touches its 20 dma.&
My inner investor remains bullishly positioned. My inner trader is tactically long the S&P 500. He plans to exit most if not all of his position once the VIX falls to its 20 dma. Stay tuned.
Disclosure: Long SPXL


It should also probably be noted that a number of important breadth-of-market indicators aren’t doing that well. A couple of examples are;
a) S&P 1500 Cumulative 4 Week New Highs – New Lows (Tag #SP15004WHL.XASE on my system) rolled over on the 17th June.
b) S&P 500 % of stocks over the 50 day MA (Tag #SPX%MA50:XASE) . The 10 day EMA has been at or just below 51% since 23th June.
I have a similar trading plan as well Cam. I’m a little confused by your trade timing explanation. It would seem to suggest selling in the next couple of days/tomorrow when the VIX hits about 16. Is this a correct interpretation?
Personally, I am more leaning toward about 2 week time horizon and looking for the VIX to spike from below the 20 ma before I start dumping.
Reopening NIO/ PLTR/ QS.
Reopening JETS.
Scaling back into XLE/ KRE.
IJS.
It may be time to focus on small caps/ small-cap value.
EFV.
XLF.
IXC.
My take is that the markets back and fill today.
GDX.
COIN.
Adding to KRE.
EWZ + EEM.
ASHR.
IWM.
FXI.
VEU.
PAVE.
XLI.
A little ARKK as it pulls back.
VTV.
IMHO, I think we’re getting ready to break to new intraday highs…
Adding to IWM.
https://www.marketwatch.com/story/this-is-your-final-warning-chinese-stocks-listed-in-the-u-s-are-dangerous-to-hold-11626978306?mod=mw_latestnews
That does it! Reopening BABA + adding to FXI/ ASHR.
A pause in the markets makes sense today. We’ll find out tomorrow whether bulls can take the SPX above 4400.
Opening a position in INTC after hours.
Adding to FXI in the premarket session.
Adding to EEM.
I was clearly wrong about traders rotating back into high-beta small caps. NIO/ PLTR/ QS all taking premarket hits. I won’t be adding to my positions. More likely to be looking for exits.
The morning action feels like a retest. However, it’s not a retest of the broad indexes, but rather a retest of small caps and value.
All positions off here.
Taking a loss on the day, despite new highs in the indexes. Why? Bought the wrong sectors and/or stocks. Still up for the week.
There’s a lack of buying interest in financials, energy and small caps. Unless that changes, there’s a good chance the indexes close in the red. JMO.