Preface: Explaining our market timing models
We maintain several market timing models, each with differing time horizons. The “Ultimate Market Timing Model” is a long-term market timing model based on the research outlined in our post, Building the ultimate market timing model. This model tends to generate only a handful of signals each decade.
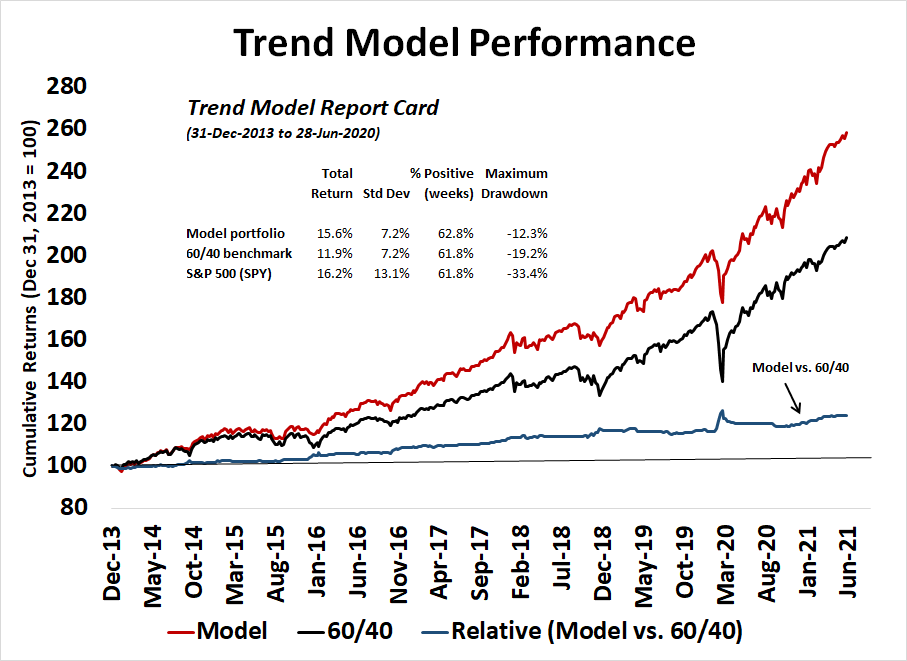
The Trend Asset Allocation Model is an asset allocation model that applies trend following principles based on the inputs of global stock and commodity price. This model has a shorter time horizon and tends to turn over about 4-6 times a year. The performance and full details of a model portfolio based on the out-of-sample signals of the Trend Model can be found here.
My inner trader uses a trading model, which is a blend of price momentum (is the Trend Model becoming more bullish, or bearish?) and overbought/oversold extremes (don’t buy if the trend is overbought, and vice versa). Subscribers receive real-time alerts of model changes, and a hypothetical trading record of the email alerts is updated weekly here. The hypothetical trading record of the trading model of the real-time alerts that began in March 2016 is shown below.

The latest signals of each model are as follows:
- Ultimate market timing model: Buy equities
- Trend Model signal: Bullish
- Trading model: Bullish
Update schedule: I generally update model readings on my site on weekends and tweet mid-week observations at @humblestudent. Subscribers receive real-time alerts of trading model changes, and a hypothetical trading record of those email alerts is shown here.
Subscribers can access the latest signal in real-time here.
Easy to be bearish
As a chartist, it’s easy to be bearish. After all, the market is experiencing numerous negative breadth divergences.

Beneath the surface, however, the technical narrative can better be described a “glass half full, or half empty” dilemma.
An internal rotation
Conventional technical analysis approaches don’t really tell the story of this stock market. The market has been undergoing an internal rotation from value to growth. While the Russell 1000 Value Index has been trading sideways, the Russell 1000 Growth Index has been advancing to fresh all-time highs. However, the value/growth ratio is exhibiting positive RSI divergences, indicating that value stocks may be ready to regain their lead.

The revival of value stocks can be better seen in small caps. The Russell 2000 Value to Growth ratio has rallied through an important relative resistance level.

Further evidence of internal rotation can be seen in the relative performance of the top five sectors of the S&P 500. These sectors comprise 75% of index weight and it would be difficult for the index to either rise or fall without the participation of a majority. Large cap growth sectors such as technology and cap weighted consumer discretionary are exhibiting relative uptrends, while the value-oriented financial stocks are lagging.

A glass half full
Evidence of poor market breadth has its silver lining. The widespread evidence of poor breadth has pushed the NYSE and NASDAQ McClellan Oscillators (NYMO and NAMO) to an oversold condition. This is a highly unusual condition because the 14-day RSI just retreated from an overbought reading. In the last four years, there were two episodes when NYMO was oversold and the RSI was overbought or near overbought. Both resolved themselves in benign manners.

The breadth divergence can also be seen in the percentage of S&P 500 stocks above their 50 and 200 dma. It’s also unusual to see the percentage of S&P 500 stocks above their 200 dma over 90% while the percentage above their 50 dma so low at about 50%. There were nine such episodes in the last 20 years. Four resolved bullishly (blue vertical lines) and five bearishly (red lines). The results can best be described as a coin toss.

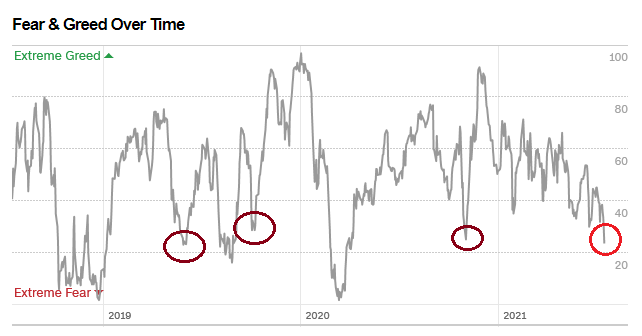
The Fear & Greed Index has fallen to 23, which is at or near levels where this index has bottomed in the past.
The market appears to be setting up for a short-term bottom. Helene Meisler tracks the number of Wall Street buy recommendations to sell recommendations. This indicator has plunged to an all-time low, which is contrarian bullish.

As well, Meisler conducts an (unscientific) weekend Twitter poll. This week’s sudden bearish turn nearly is approaching the record low level seen in January. The last time sentiment plunged was four weeks ago, in the wake of the FOMC’s hawkish pivot. The market recovered the following week when Fed speakers softened their remarks.

So where does that leave us? I continue to believe that the market has bifurcated into two distinct markets, value and growth. In aggregate, it’s difficult to make much of a judgment about the direction of the S&P 500 owing to the divided nature of market internals. The internal rotation is continuing and value is poised to gain the upper hand.
Short-term breadth and sentiment readings indicate that a rebound is likely, but the bulls shouldn’t bring out the champagne just yet as the market could just be at the bottom of a trading range. Until we see a definitive bullish or bearish catalyst, my base case calls for a sideways market with a possible minor upward bias.
My inner investor is remains bullishly positioned in value and reflation-themed stocks. Near-term downside risk is relative low and he is not concerned about minor blips in stock prices. My inner trader is tactically long the S&P 500 in order to scalp 1-2%. The market is at the bottom of a short-term trading range and it is expected to rebound over the next week.
Disclosure: Long SPXL
When monitoring poor breadth, cumulative divergence between the trends of the senior index and the AD line matters. This divergence initiated from the last dip in June, and has barely started closing. I estimate that it could be restored by close of trade on Tuesday, at the soonest. Losses until then.
Cam – Do you have a take on the SPYV:SPYG chart that Callum Thomas includes in this week’s ChartStorm, which he basically describes as a rotation (from growth to value) that has now ‘unrotated?’ Based on his chart, the ratio of Value:Growth appears to be back at January levels.
I think it is a more appropriate idea to not look at the market as we did the last 15 months. Pretty much all the info have been reflected in prices at this stage. The wholesale type of reversal is very unlikely going forward. We are entering the phase where quality factor will have more weight.
Stock picking and more patience is needed to generate extra alpha. Secular trends and monopolies are better targets.
Reopening XLE/ KRE in the premarket session.
Reopening starters in EEM/ FXI.
XLF. Currently changing hands near June 18 and July 8 levels.
Reopening JETS. Currently back near YTD lows.
Scaling back into GDX.
Reopening XLI near July 8 levels.
Adding a second tranche to KRE.
Adding second tranches to XLE/ GDX.
Reopening VTV at the open.
PICK.
NIO/ PLTR/ QS/ COIN.
PAVE.
AA.
Adding to XLI.
Adding to JETS.
My opinion is that we’re seeing capitulation at current levels.
EWZ.
VT.
Pretty brutal selling. I think it reverses soon.
EFV.
IXC.
Fear and greed 18. Usually <20 is a decent bet.
If the indexes fail to reverse from here, my take is that I’m not unhappy owning positions at these levels – a few of which go back to January/ February levels.
Closing NIO/ QS/ PLTR/ COIN for modest gains.
My official comment for this mornings’ gap down is “Ouch!”
What a surprise today …:-\