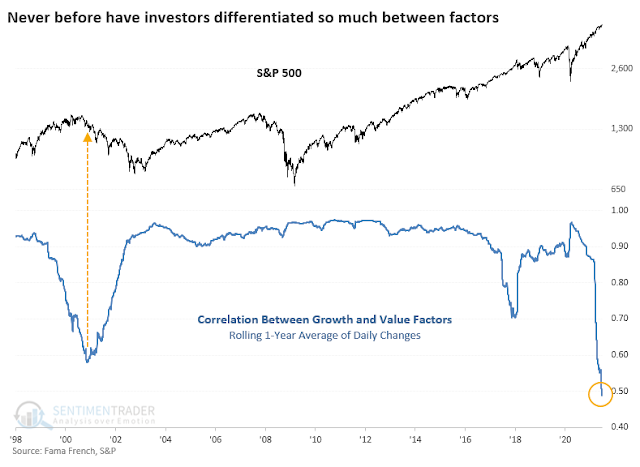
Mid-week market update: I’ve had a number of questions from readers about the warnings of imminent market declines from SentimenTrader. In this post, Jason Goepfert’s headline was “This Led to Declines Every Time in the Past 93 Years”. He highlighted the market’s poor breadth, as measured by the percentage of stocks above their 50 dma.
Going back to the mid-1920’s, there have only been a handful of dates with breaks like this. It happened in 1929, 1959, 1963, 1972, 1998, and 1999, and all of them ended up preceding losses in stocks.

Relax, the market isn’t going to crash. Here’s why.
A bifurcated market
Goepfert gave the answer in a
separate article, “The Correlation Between Growth and Value Has Never Been Lower`. Even though he interpreted the data in a bearish way, his observation is consistent with my past analysis that this is a highly bifurcated market that’s divided between growth and value stocks.
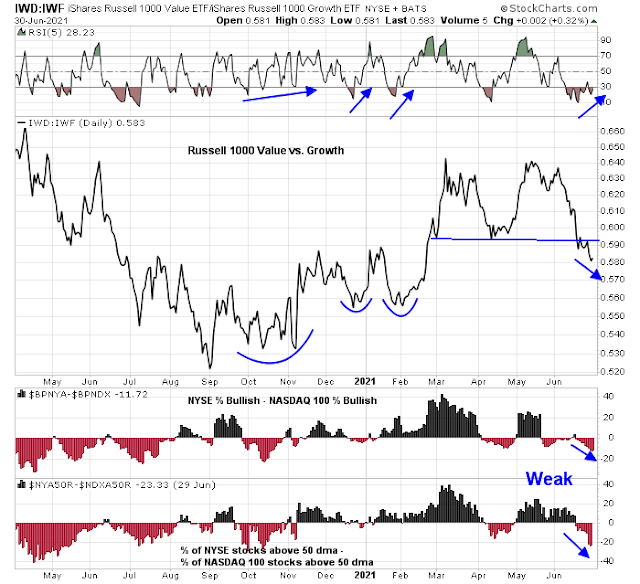
The stock market has been rising steadily because growth and value have been undergoing an internal rotation. When growth falters, value takes up the baton of leadership and vice versa. Right now, the value/growth ratio has violated a key relative support line and internals look terrible (negative for value, positive for growth). On the other hand, the ratio is exhibiting a positive RSI divergence. In the past, these negative divergences have led to a bottom and turnaround for value stocks. Don’t be surprised to see history repeat itself in the coming days.
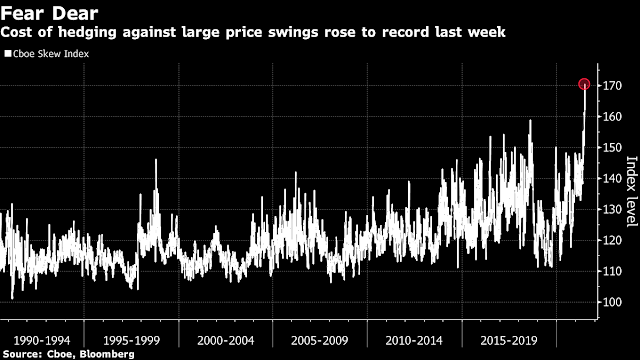
As the fears of the Delta variant slowing down the economic recovery swept through the markets, it was no surprise that SKEW, which measures the cost of hedging a tail-risk event, spiking. It was also not a surprise to see growth ascendant under such conditions. If growth is becoming scarce, growth stocks attract a bid.
On the other hand, Moderna announced that its vaccine is protective against the delta variant (via
CNBC). It remains to be seen how the value and growth stocks will react in the coming days as these fears recede.
Another supportive element for the strength of the S&P 500 comes from a more nuanced interpretation of breadth readings. Sure, the NYSE A-D Line has not confirmed the index’s recent highs, the market is exhibiting negative RSI divergences, and the percentage of S&P 500 stocks above their 50 dma look terrible. On the other hand, the percentage of NASDAQ stocks above their 50 dma is showing signs of life, which is an indication of the internal growth and value rotation, and the percentage of S&P 500 stocks above their 200 dma is still above 90%.
Putting it another way, short-term breadth is challenging, but long-term breadth remains solid. I interpret these conditions as the market may see a shallow pullback of -5% or less, but downside risk is limited. My base case scenario is still a sideways choppy market, though I would not discount the S&P 500 undergoing a slow grind-up over the next two or three weeks.


Funny that this morning when Sentimentrader came out with this analysis, I thought I was forwarding it to my assistant with a comment that it was a “Dumb Analysis ” because the year 2000 drop was Growth plunging versus Value and the 2020 was Value plunging versus Growth. But the email went to Jason at Sentimentrader. LOL. Here is what he said; External/Externe
“No worries, I’ve been called much worse. The point originally wasn’t to measure whether growth or value was leading/lagging – that’s been covered extensively – it was more just to check how much they’ve been moving together, up or down, with either one leading, as a sign of internal rotation and whether that indicated potential complacency.”
The other “dumb” thing about their analysis is using a one year lag. That hides the massive performance of Value since the November 9 vaccine day. If we use a 6 month lookback instead of a year, the picture would not just be different, it would be the opposite with Growth outperforming from Feb 2020 to Vaccine day and then Value leading. No complacency at all.
That reminds me, I think any analysis that uses a 200 day lookback such as a moving average is flawed because the Covid Crash was so fast deep and unusual and therefore mathematically makes everything look high versus it. There is no historic analogue to the plunge so using the 200 day standard is misleading until the plunge action drops off the calculation.
Ken,
I’ve been meaning to thank you for a while now. Your comments are very thoughtful and nuanced. They complement Cam’s deep analyses so well.
Your comments here first identified the value / growth bifurcation, at least to me. Actually this was in the form of your Speculative Growth / Quality Growth / Value / Resource Value breakdown. This has been enormously helpful to me as I think of ARKK + semis / QUAL / IJR + XLI / XME + FCX + COPX in separate buckets. (VTV didn’t work for me, too many value traps in it. PICK didn’t work for me, too levered to China. Sticking with EWC for now)
So Ken, thank you for adding new dimensions to the conversation here. I appreciate your insights enormously! Perhaps some day I will have the opportunity to buy you a cup of coffee or a beer.
Thanks Chuck. I look forward to that Latte.
These buckets are swinging in different directions so violently that they often overwhelm the merits of the individual company.
I agree with Chuck’s comments. Thanks!
Opening GDX on the mid-morning pullback.
Reopening EEM/ FXI.
PICK.
ASHR.
All positions off. The only decent gain was on GDX.
https://quantifiableedges.com/first-day-performance-of-each-month/
Six months into the year, IWD(value) outperformed IWF (growth) by roughly 4%. Recently IWD has stalled while IWF has strong momentum. This in the face of economy that should continue to expand in the second half.
Barclays has called the value trade to be largely over. Economy may not grow as much as forecast due to shortages of all kinds. And next year the growth is forecasted to moderate to 2.5 -2.7% rate. I think the market is looking ahead and secular growth should outperform.
This is how I plan to adjust.
One scenario that doesn’t seem to worry many people is the possibility that one or more variants (now commonly mocked in the media as ‘scariants’) may find a way around the vaccines.
Of course, no one know what the catalyst for the next selloff will be. That’s the nature of the game.
Reopening positions in FXI/ EEM/ ASHR premarket.
At some point buying the premarket pullbacks will stop working – maybe even today.
XLE.
KRE.
BA.
PICK.
NIO.
BABA.
JETS.
Closing BA.
Adding to KRE.
Closing NIO.
Closing PICK.
Closing all positions here.
I usually have a ‘target’ in mind for each morning, and once it hits I’ve found that it pays off to lock in gains.