Preface: Explaining our market timing models
We maintain several market timing models, each with differing time horizons. The “
Ultimate Market Timing Model” is a long-term market timing model based on the research outlined in our post,
Building the ultimate market timing model. This model tends to generate only a handful of signals each decade.
The
Trend Asset Allocation Model is an asset allocation model that applies trend following principles based on the inputs of global stock and commodity price. This model has a shorter time horizon and tends to turn over about 4-6 times a year. The performance and full details of a model portfolio based on the out-of-sample signals of the Trend Model can be found
here.
My inner trader uses a
trading model, which is a blend of price momentum (is the Trend Model becoming more bullish, or bearish?) and overbought/oversold extremes (don’t buy if the trend is overbought, and vice versa). Subscribers receive real-time alerts of model changes, and a hypothetical trading record of the email alerts is updated weekly
here. The hypothetical trading record of the trading model of the real-time alerts that began in March 2016 is shown below.
The latest signals of each model are as follows:
- Ultimate market timing model: Buy equities
- Trend Model signal: Bullish
- Trading model: Neutral
Update schedule: I generally update model readings on my site on weekends and tweet mid-week observations at @humblestudent. Subscribers receive real-time alerts of trading model changes, and a hypothetical trading record of those email alerts is shown here.
Subscribers can access the latest signal in real-time here.
The Fed’s hawkish pivot and reversal
In the wake of the Fed’s unexpected hawkish message, the markets adopted a risk-off tone the week of the FOMC meeting. As Fed officials walked back the aggressuve rhetoric, both the S&P 500 and NASDAQ 100 resumed their advance and climbed to all-time highs.
Beneath the surface, however, there was some unfinished business as the internal rotation sparked by the FOMC meeting hasn’t unwound itself. Let’s take a more detailed look.
Bond market response
Starting with the bond market, the 10-year Treasury yield spiked and rose above a key support turned resistance level in reaction to the FOMC message. Yields retreated below support as the Fed moderated its tone but rose again to test resistance on Friday. The 2s10s yield curve, which had begun to flatten starting in late May, continued to flatten during this period.
Given the high duration and interest rate sensitivity of growth names, the decline in the 10-year yield has put a bid under the NASDAQ 100.
How persistent is the growth revival?
The cyclical response
Investors can get some clues from cross-asset analysis. The cyclically sensitive copper/gold and base metal/gold ratios are showing some signs of strength, signaling global reflation. If this trend continues, it should put upward pressure on the 10-year yield.
Cross-asset analysis of gold and gold-sensitive assets tells a similar story of reflation. The USD strengthened (bottom panel, inverted scale) in the aftermath of the FOMC meeting. The greenback’s rally has reversed itself and weakened. Similarly, TIPs prices fell after the FOMC, but have rallied to test their old highs. Gold prices have been consolidating sideways during this period, but as gold tends to be positively correlated with TIPs prices and negatively correlated with the USD, this environment should be bullish for gold.
JPMorgan also estimated that CTA positioning in gold is a crowded short extreme. The odds of a bullish reversal is high.
In addition, Mark Hulbert pointed out that gold newsletter market timers had turned bearish, which is contrarian bullish:
The HGNSI has moved from close to the 90th percentile of the distribution to the 14th. Some may consider that already to be a big enough drop to support a rally; other contrarians may insist on waiting until it drops into the bottom decile — the threshold for which is minus 14.8%. Depending on gold’s action this week, that could happen within a matter of days.
Over in the stock market, the relative performance of cyclical stocks has largely lagged the market during this period, though deep cyclicals like energy and metals and mining are exhibiting a bit more strength than other cyclical groups. Even news of President Biden’s bipartisan infrastructure deal didn’t move the needle on these stocks.
Value vs. growth response
In short, equity investors are not fully convinced about a revival of the reflation trade. As cyclical sectors have a high overlap with value stocks, we can also see this effect in the value and growth relationship. The value/growth ratio has broken a key relative support level, and breadth is weak for value. However, the ratio is exhibiting a (value) bullish RSI divergence, indicating that a reversal could be near.
Technical vs. fundamentals
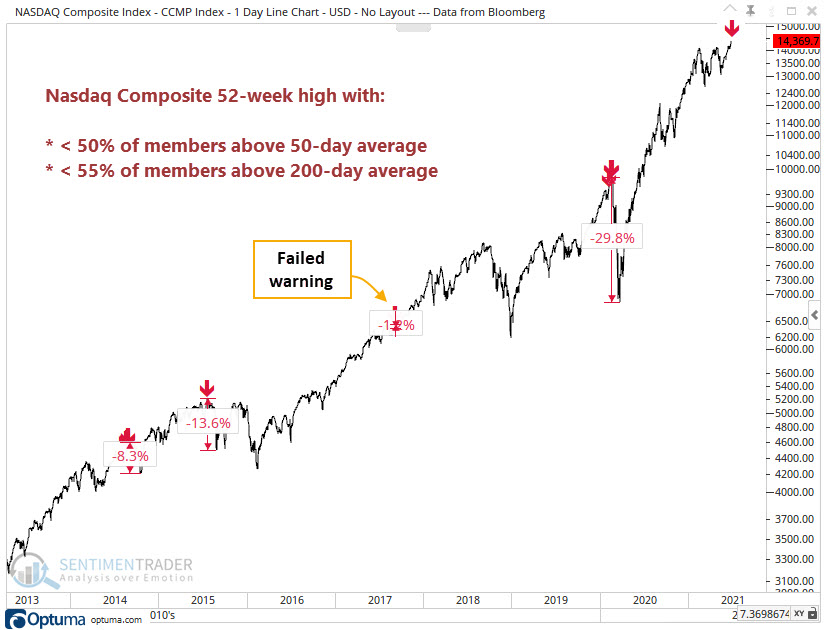
To be sure, the current advance has been marked by numerous worrisome breadth divergences. In particular, the NYSE Advance-Decline Line has failed to confirm the fresh highs.
As well,
SentimenTrader issued a warning about the NASDAQ breadth weakness in the face of new highs.
On the other hand, FactSet reported a surge in earnings estimates and a record number of companies with positive earnings guidance. This should be supportive of equity valuation and equity price gains.
RSM US chief economist Joseph Brusuelas pointed out that there is $1.6 trillion in excess savings on household balance sheets, which translates to a tsunamic of post-pandemic consumer demand.
I interpret this as the stock market may have gotten ahead of itself and it may be due for a period of sideways consolidation and minor weakness, but strong underlying fundamentals will put a floor on stock prices should they correct.
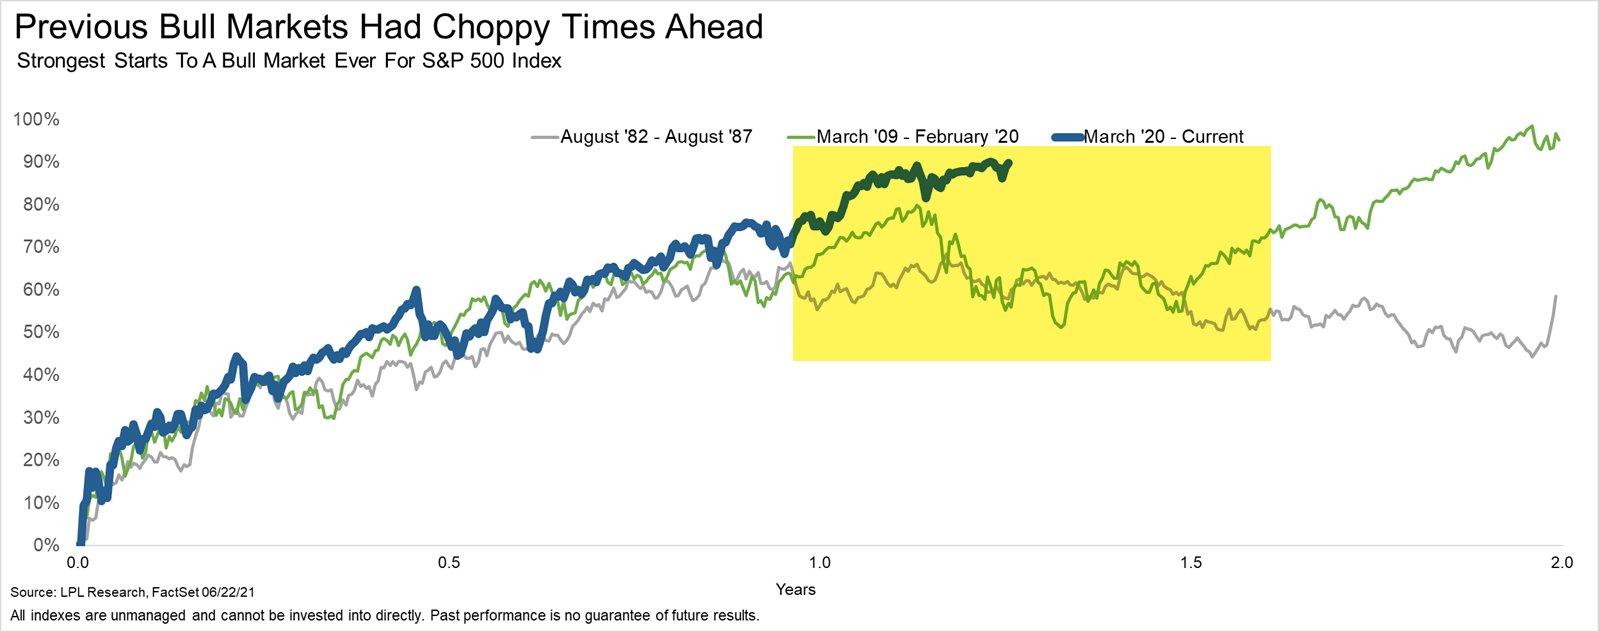
Ryan Detrick of LPL Financial observed that this bull has been extraordinarily strong. In the past, the market has experienced some choppiness after robust first year gains. That’s my base case scenario.
In summary, the “round trip” exhibited by the major averages after the FOMC meeting is hiding a number of rotational reversals. While growth stocks are in ascendancy, cross-asset analysis strongly suggest that the reflation and value trade is about to regain the upper hand. However, negative breadth divergences are flashing warning signs that possible weakness or sideways consolidation is ahead.
Disclosure: Long GDX


Cam
You show weakness in Tech. For long term portfolio construction, wouldn’t this be the time to add growth names to portfolios, especially those who are underinvested in tech?
You have said multiple times that cyclicals are unlikely to grow indices because they are a very small component of the index complex. Most rank and file portfolio managers have no option but to keep buying tech, all said. How long can cyclicals/value rally last? For time horizons of a few years and longer, wouldn’t one need a healthy slice of tech?
Here is an update about SentimentTrader’s graph above. As of last Fri the percentage of NDX above 50ma is 72.55% and 86.27% above 200ma. Essentially confirms NDX strength.
All signs point to strong Q2 earnings reports. So as in Wall St tradition the front-running already started. Don’t be surprised if you continue to see markets rallying. The most exciting sectors are tech, discretionary, and communication.
https://money.cnn.com/data/fear-and-greed/
It is said that stock markets climb a wall of worry. The CNN fear and greed index is not exactly in a complacent mode.
The Growth versus Value debate is the key to performance this year. Here is a long term chart of their relationship that shows how it is unfolding.
https://refini.tv/2U89PSo
From 2017 to the beginning of 2020, Value had four years of steadily and increasing underperformance from 5% to 9%. Then in 2020 the pandemic hit the economically sensitive Value hard and sent Growth to amazing popularity. Value underperformed by 30%. So 2017 to the low in 2020 saw a huge drop in relative performance.
Then comes the surprisingly, amazing vaccines and the economic outlook changes dramatically for the better. The gross underperformance is reversing. But by how much and how will it unfold?
I look upon the pandemic like a big boulder has been dropped into a pond, The first wave outward had growth surging hugely. Then the vaccine and Value surged with a big outperformance but with less energy. Now we are experiencing 8% monthly swings (BTW this used to take a year which shows you how strong feelings are today) in a time of investor indecision as the worry, “Is the old Growth over Value narrative back in play or is Value the area that will do better with the reopening with an accommodating Fed leading to a surging economy and higher earnings for Value companies. We can understand the mixed feelings since there has been four solid years of Growth outperformance and less than one of Value doing better. It is so easy to believe the naysayers who knock Value because investors haven’t bought into the narrative. So far it’s just a trade. But for example, the Value ETF trades at a 12X PE and 2.5% dividend yield versus the FAANG Friendly Growth ETF at 34X PE and a 0.6% yield.
My read of the long-term chart says that there is more relative gain for Value in 2021 as it went way to low in 2020 or another way of looking at it, the Innovative Growth area which is a big part of Growth, went too high in a bubble which is now popping.
My guess is second quarter earnings with accompanying positive forward guidance will kick-start the next Value relative surge.
We have fiscal spending, low rates from the Fed, QE of $120 billion a month, extremely low credit spreads that are falling, massive savings hoard wanting to be spent as the reopening progresses. This is a bull market environment.
Those investors who were waiting to buy the dip should not be fooled by watching the S&P 500. It is the sum of two things, Value and Growth, swinging in different directions. The dip is in the 8% relative dip in Value that has happened over the last month going into a strong earnings season for this economically sensitive sector.
Ken, how do you see chances of Value in Asia and Europe?
I don’t have a way of tracking Value in Asia but Value in Europe is doing okay but less than US. If Value in the US or Canada is similar to Europe, I stick to North America.
I like International High Quality DNL. I consider High Quality a Growth/Value combination with a Value tilt. I am avoiding Asia. Momentum is poor and the narrative around the China – America standoff is bad for it and the region.
I will say that Value is very oriented around Banking an European banks have been a disaster. Maybe that means a big recovery is coming but…..
Also Value is energy and the Energy industry in Europe is under siege.
These are negatives for European Value.
Hi Ken,
KRE/SPY is breaking down a key support. EUFN is near a key level. Are you at all concerned about the performance of banks?
Guess the underlying driver/question is yield curve. Recent drop is only a correction before marching higher. It should be favourable for banks.
Your thoughts?
What happens after the first rate hike with Canadian stocks, Japanese, EM, commodities? I guess the dollar would strengthen
My guess is that commodities will be flying when they start raising rates and that will be a fine time for Canada, Commodities and Value.
thanks!!
As the $ strengthens, shouldn’t commodities weaken?
The Fed is far more frightened of a collapse in stocks than it is in inflation. We can say this shows cowardice and keeps the Fed will behind the curve. The transitory meme will collapse in a few months. Many price and wage increases will be sticky once they start to plateau. The Fed lurches between between being ahead of trends or behind them. It never really follows the data and where is is going.
Taking swings at XLE/ KRE.
JETS.
GDX.
EFV.
XLI.
IXC.
PICK.
Decent test/retest of value holders this morning.