Mid-week market update: Should you Sell in May and go away? While many traders are familiar with the Wall Street adage, what “Sell in May” really means is the six months starting May 1 has experienced subpar returns compared to the six months starting in November 1. It’s not necessarily bearish.

While it’s not advisable to trade strictly on seasonality, investors might want to be extra cautious with their equity allocations this year.
The caution zone
So far, what we have are bearish setups, but no definitive signs of downside breaks.
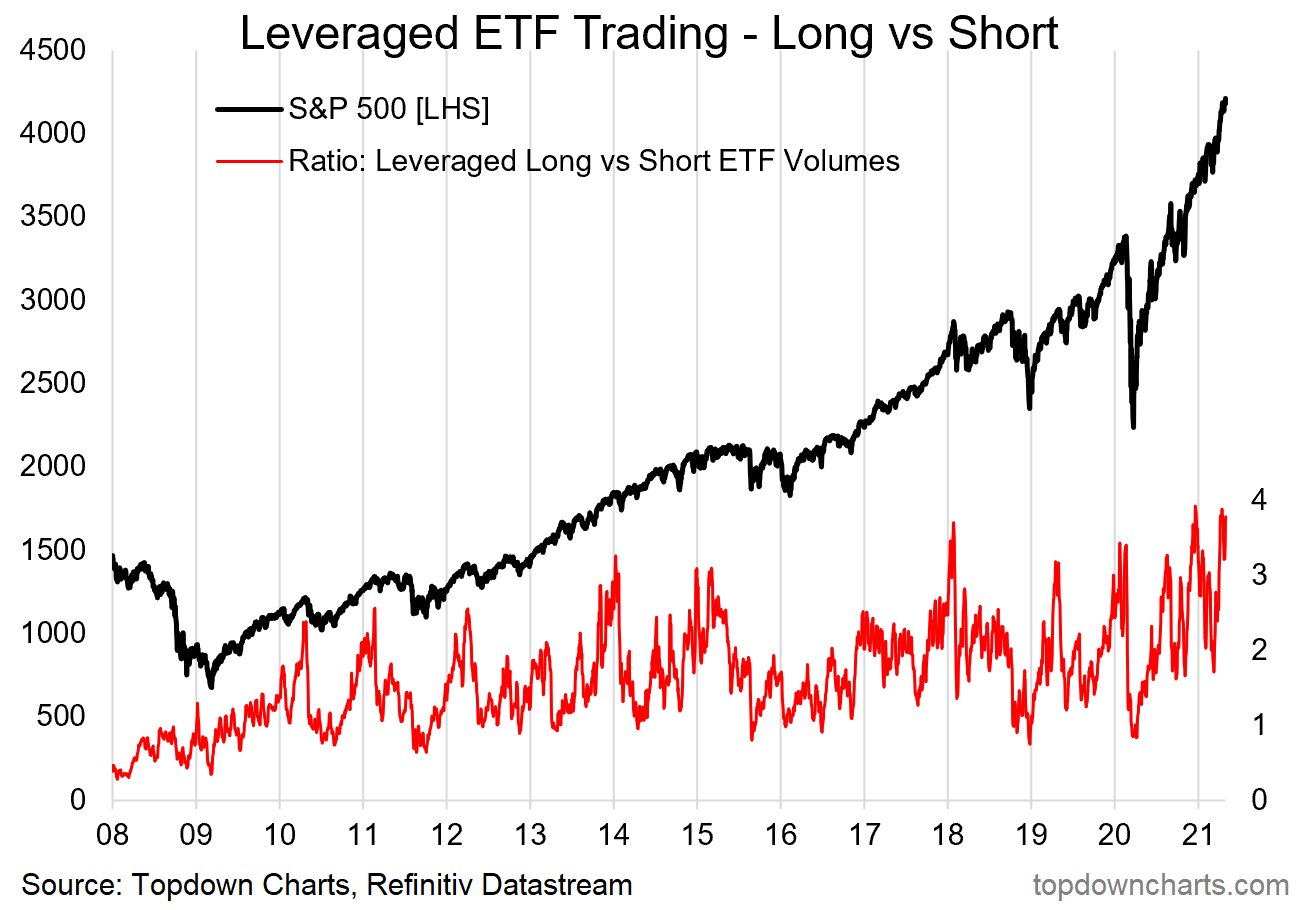
Callum Thomas observed that the ratio of leveraged long to short equity ETF volume is highly extended and in the “risk zone”.
Ryan Detrick pointed out that the stock market has paused its rally about now when coming off the recessions of 1982 and 2008.

However, these are all only cautionary signs and none of them are signals to sell everything or to go short the market.
Not bull nor bear, but a roller coaster
Even though I have warned about rising risk in the past few weeks. Neither the bulls nor the bears have gained the upper hand.
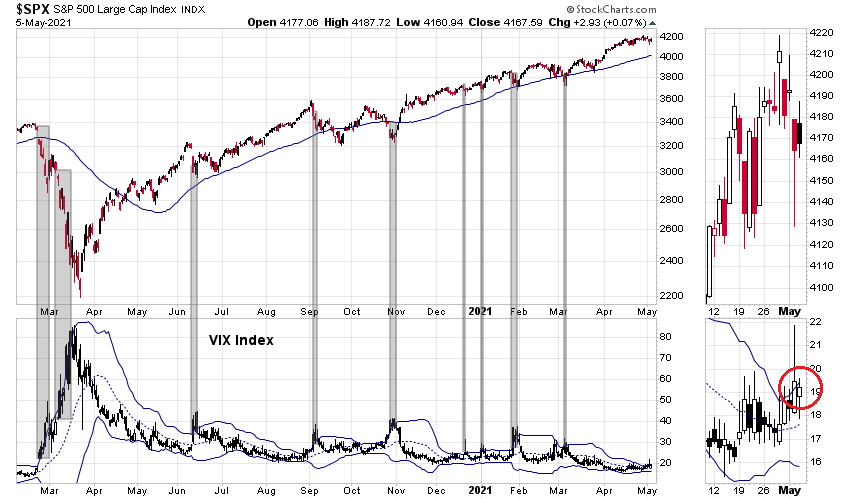
The stock market sold off yesterday (Tuesday) when Treasury Secretary and former Fed chair Janet Yellen said, “It may be that interest rates will have to rise somewhat to make sure that our economy doesn’t overheat.” It recovered later in the day when she walked back those remarks and it recovered further today. From a technical perspective, the VIX Index spiked above its upper Bollinger Band yesterday, which is an indication of an oversold market. In the past, such VIX upper BB episodes have either signaled the start of a correction, or a once-and-done downdraft. Today’s recycle of the VIX suggests yesterday’s weakness was of the latter variety.
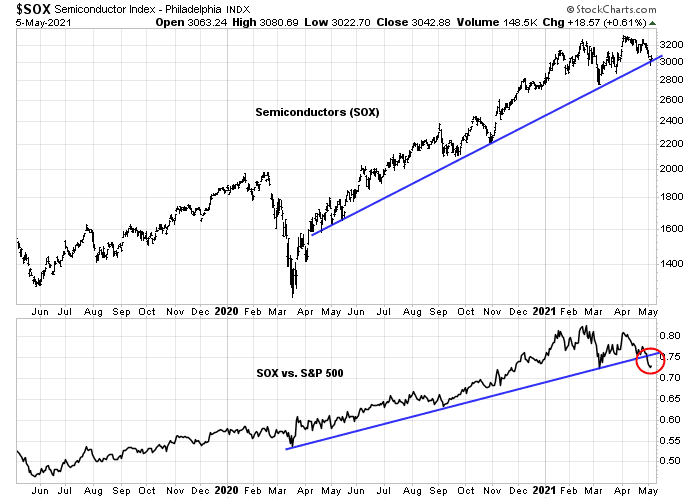
Investors need to be prepared for a roller-coaster market with choppy price behavior. Sure, there are some signs of wobbles. The most worrisome is the violation of the relative uptrend by semiconductor stocks. Semiconductors are growth cyclicals, and they should be beneficiaries of the chip shortage. Their poor relative strength is an early warning that risk appetite is on the decline.
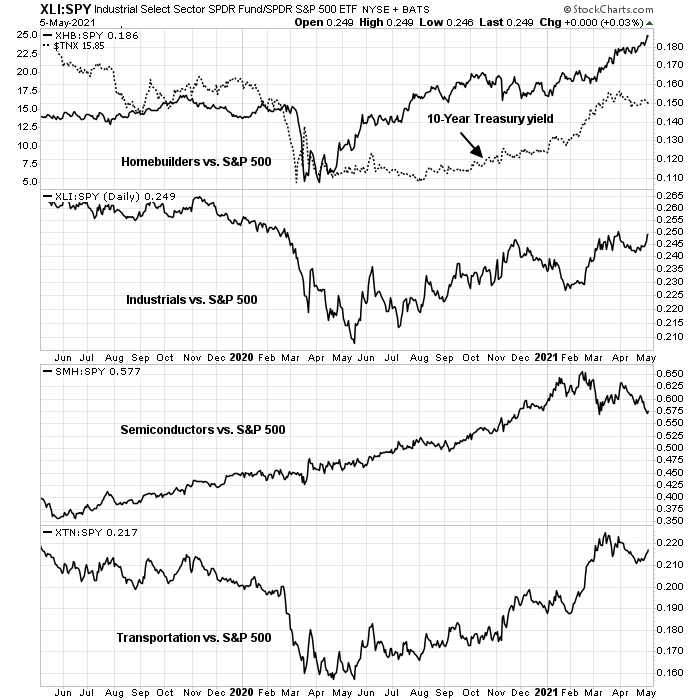
On the other hand, a review of other cyclical sectors and industries shows that the poor relative strength of semiconductors is an anomaly. Other cyclicals remain in relative uptrends.
As I have pointed out before, this is an increasingly bifurcated market. Growth stocks are struggling while value stocks are performing reasonably well. The Russell 1000 Value Index remains in an uptrend while the Russell 1000 Growth Index has violated a keys support level.

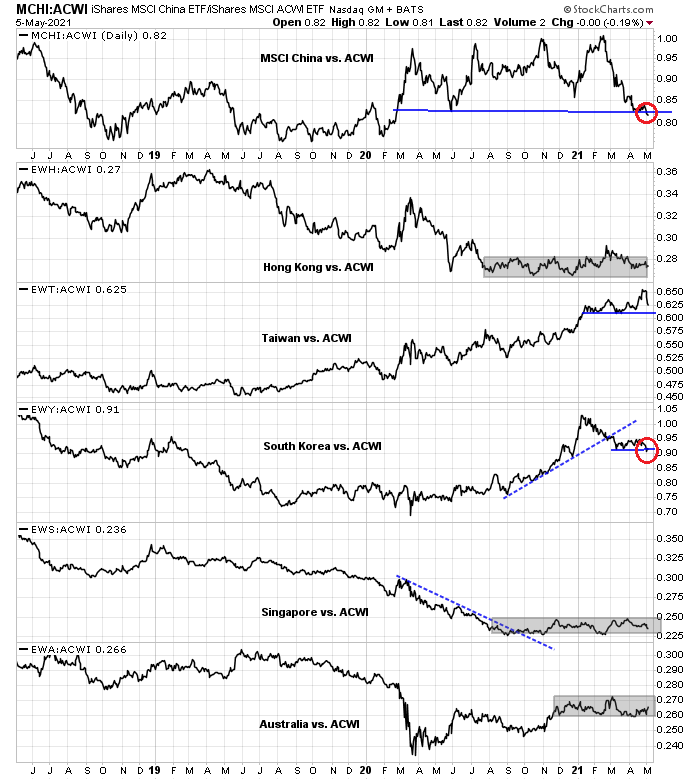
Watching China for clues
I conclude from this review that the stock market is vulnerable to a setback but it’s not quite ready to correct just yet. In order for the market to correct, the value and cyclical sectors need to face a growth scare.
That growth scare may occur as the Chinese economy slows. Real-time market data are suggestive of a China slowdown. The AUDCAD exchange rate is testing a keys support level. Both Australia and Canada are resource exporters. Australia is more sensitive to China while Canada is more levered to the US economy. The weakness in the AUDCAD rate is an implicit signal of slowing Chinese growth.

As well, the stock markets of China and her major Asian trading partners are not behaving well when measured against the MSCI All-Country World Index (ACWI). MSCI China has violated a relative support line, and so has South Korea. The rest are exhibiting weakening or range-bound patterns. (All prices are in USD).
The Trend Asset Allocation Model is still bullish and it is not designed to spot minor (5-10%) corrections. My inner investor is therefore bullishly positioned, though he has sold covered call options against selected existing positions.
My inner trader is on the sidelines. The long-term trend for stock prices is still up. The risk/reward ratio of trying to short the market without a definitive downside break is unfavorable.
In short, I am cautious, but not bearish.
Great analysis Cam. Regarding the AUD:CAD analysis, note that Australian products are now largely sold to the AsiaPac region rather than to China because of the economic coercion with the exception of iron ore which is at all time high prices.
I stand corrected, but AsiaPac is highly sensitive to China.
I read often about how the Chinese economy is slowing and people take from that its doing fewer sales. But that is not the case. What they should say is the Chinese growth rate is slowing. So last year the growth rate was 7% let’s say and this year it is 5%.
So all things being equal, let’s say for copper, they would buy 5% more. So if they bought huge amounts to propel the copper price higher last year, this year they are buying that amount plus another 5%.
That is a lot different than if they are buying 5% less this year, as in them slowing.
In my mind, Chinese commodity demand while growing slower this year will be higher than last year accompanied by much higher demand from the rest of the world. That means these higher prices will stick and shortages will be common.
When we hear that semi-conductor shortages are hurting production, we assume that means falling sales. But the auto companies just reported all-time highest sales for April. The shortages just meant the incredible high demand could have boosted sales higher than the companies had planned for.
The demand for commodities is through the roof and the US economy and now Europe is just starting to open up. Thinking that Chinese demand is down and commodity prices will get a breather is wrong mathematical thinking.
That depends on WHY the Chinese economy is slowing. If, for instance, real income growth (relative to inflation or inflation expectations) for the average consumer is slowing, static, or even negative – then the entire demand curve for a given commodity will shift – less demand, for instance, for new iPhones or new cars and the commodities needed to manufacture one.
Another consideration might be the time element. The transition from let’s say 7% growth to negative growth would naturally first fall to 5% growth. Companies would understandably want to extrapolate to the extent possible when planning ahead – commodity prices are extremely sensitive to a myriad of factors, and a slowing of demand IMO is a red flag. How many iPhones and cars do people need, at what price points, and how will demand change as real income growth declines?
In other words, using your example of copper – what’s behind the 5% number? Is it possible that high-end markets are saturated, with manufacturers now targeting lower-end buyers with higher price sensitivity and thus lower margins? A slowing from 7% to 5% is more than a shift from 7% to 5%. If the aggregate end result is a ‘shift to the left’ in the demand curve, then I would say the effect on commodity prices is not that simple – it’s the kind of math where a dozen economists will arrive at a dozen different results.
Measured selling in ARKK thus far. Watching for a transition to disordered behavior.
Too many traders looking for ARKK to fail here – thus unlikely to be imminent.
VIAC with a stellar Q1 earnings report this morning has now given back all of its early gains and now 2% in the red. Taking a swing here.
Taking a swing @ PLTR sub-20.
Some of these growth names may (or may not) be starting to reverse from a brutal bear market.
NET. I realize it’s ahead of earnings, but I’ve been waiting for a reentry point – partial position.
Closing NET on the +8% after hours pop. Will revisit on Friday.
Holding VIAC and PLTR overnight.
Goldman says hedge funds have shorted tech 9 of the past 10 days, so a short squeeze may be in the offing.
https://www.zerohedge.com/markets/here-comes-squeeze-goldman-prime-says-hedge-funds-shorted-tech-9-past-10-days
This is no surprise. Since COVID19 started to spread, the subsequent V bounce in price has left hedgies in distant dust. Many of them have gone out of business. The rest is getting very desperate, and started to employ all kinds of tricks trying to boost performance. You can see the continuous misinformation campaign in all headlines fed to the press. At this moment you see clearly what they are doing: pair trade: long commodities and short tech, vertically up and down respectively.
It will reverse violently. My personal opinion about hedgies is these people are purely worthless. I would like the hedgies to go away and disappear completely. On the other hand I want them to stay so I can make money fast and frequently by acting on their desperation. These people are not going to win because the math is stacked against them. The only thing they might hope to accomplished is to scare inexperienced investors into doing something foolish.
I think your wishes may get realized sooner than you expected. After the jobs report, the yields are down and the techs are up. Now if the hedgies rush to cover, may be we will see commodities go down and techs start their vertical ascent in coming days and weeks.
Let’s see.
My sixth sense is leaning that way.
VIAC and PLTR closed on modest strength in the premarket session.
ARKK may have marked a ST bottom on Thursday – if so, I missed the buying opp.
I still think Cam has it right – a -5% to -10% correction. However, is it possible we’re all looking in the wrong direction(s) as far as sector performance? What if (against consensus expectations) it’s XLK/ ARKK/ EVs/ SPACs that begin to climb out of a brutal market, while value/cyclicals begin a countertrend decline? Just a thought.
Meant to say ‘brutal bear market’ with respect to ARKK/ EVs/ SPACs.
I’m trading cautiously this week – sizing smaller and less inclined to hold positions overnight.
Currently up double digits ytd, and sometimes it feels as if I’m up by 10 points with 53 seconds on the clock. Do I run a pass play for another touchdown, or simply run out the clock?
AMZN as it retraces to 3300.
TWTR.
QS.
Reopening PLTR.
Reopening NET.
@rxchen2, sounds like time for the victory formation
After decades of trading, the realization arrives that trading is not unlike everything else in life. There is never a time when one declares victory – it’s just a series of wins and losses over a lifetime of grinding away. At some point, we accumulate a bit of wisdom:
(a) Maintain balance. Not only in trading/trades, but in how much time/effort we devote to trading.
(b) When it feels as if we’re on top of things, pull in – it’s about to get tougher. When it feels as if we’re deep in the hole, prepare for aggressive trading.
(c) If I’m fortunate enough to average ~7% a year, that works for me! I may not outperform the SPX, but I will also never experience the devastation of a -50% downturn.
Out of all positions.
My only gains today were in the premarket session.
Reopening a few positions on POTENTIAL retests of recent lows.
ARKK/ IQ/ QS/ PLTR/ AMZN/ NFLX/ TSLA.
Size appropriately and add on confirmation only. What appears to be a retest can easily turn into a breakdown. There are no certainties, only probabilities that we must manage.
Adding a position in NIO.
NET.
RIOT.
Out of all positions. Sure, they may all close higher, but it’s been a pretty good day. Total risk exposure of less than two hours for a one-day return of ~+0.15%.
And ten minutes after closing AMZN it’s ten dollars a share lower and I’m considering another entry.
With less than thirty minutes to the close it’s probably not a good idea.
I’m not a big fan of hindsight, but based on my watchlist, I would have done better buying the morning pullback in value/cyclicals.
I’m beginning to have reservations concerning the 5-10% pullback scenario because RSI is not acting as it has in any of the recent pullbacks in which SPY has breached its 50 day moving average. Any thoughts?