Preface: Explaining our market timing models
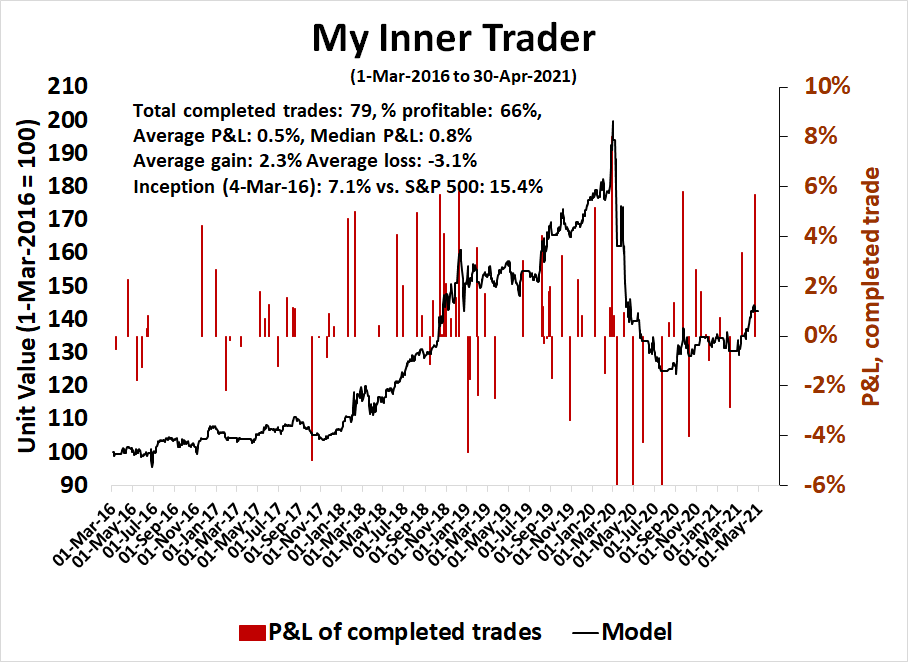
My inner trader uses a trading model, which is a blend of price momentum (is the Trend Model becoming more bullish, or bearish?) and overbought/oversold extremes (don’t buy if the trend is overbought, and vice versa). Subscribers receive real-time alerts of model changes, and a hypothetical trading record of the email alerts are updated weekly here. The hypothetical trading record of the trading model of the real-time alerts that began in March 2016 is shown below.
- Ultimate market timing model: Buy equities
- Trend Model signal: Bullish
- Trading model: Neutral
Update schedule: I generally update model readings on my site on weekends and tweet mid-week observations at @humblestudent. Subscribers receive real-time alerts of trading model changes, and a hypothetical trading record of those email alerts is shown here.
Subscribers can access the latest signal in real-time here.
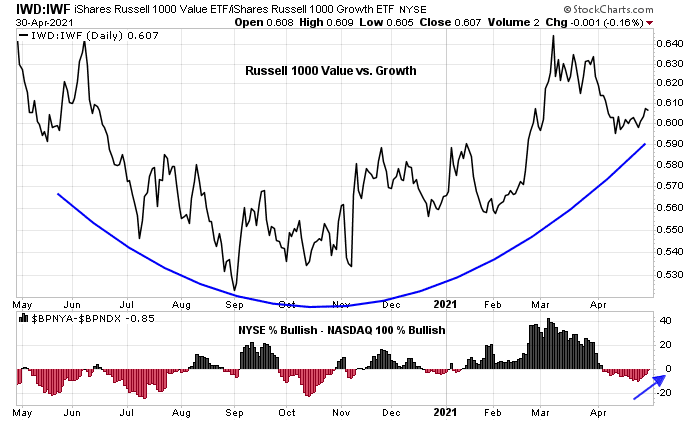
What’s wrong with this picture?

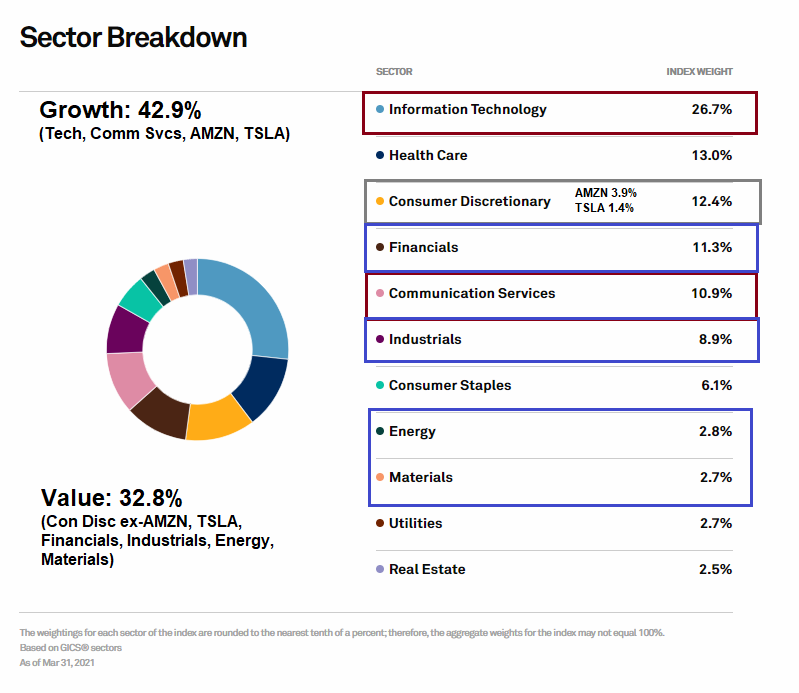
A failure of leadership?

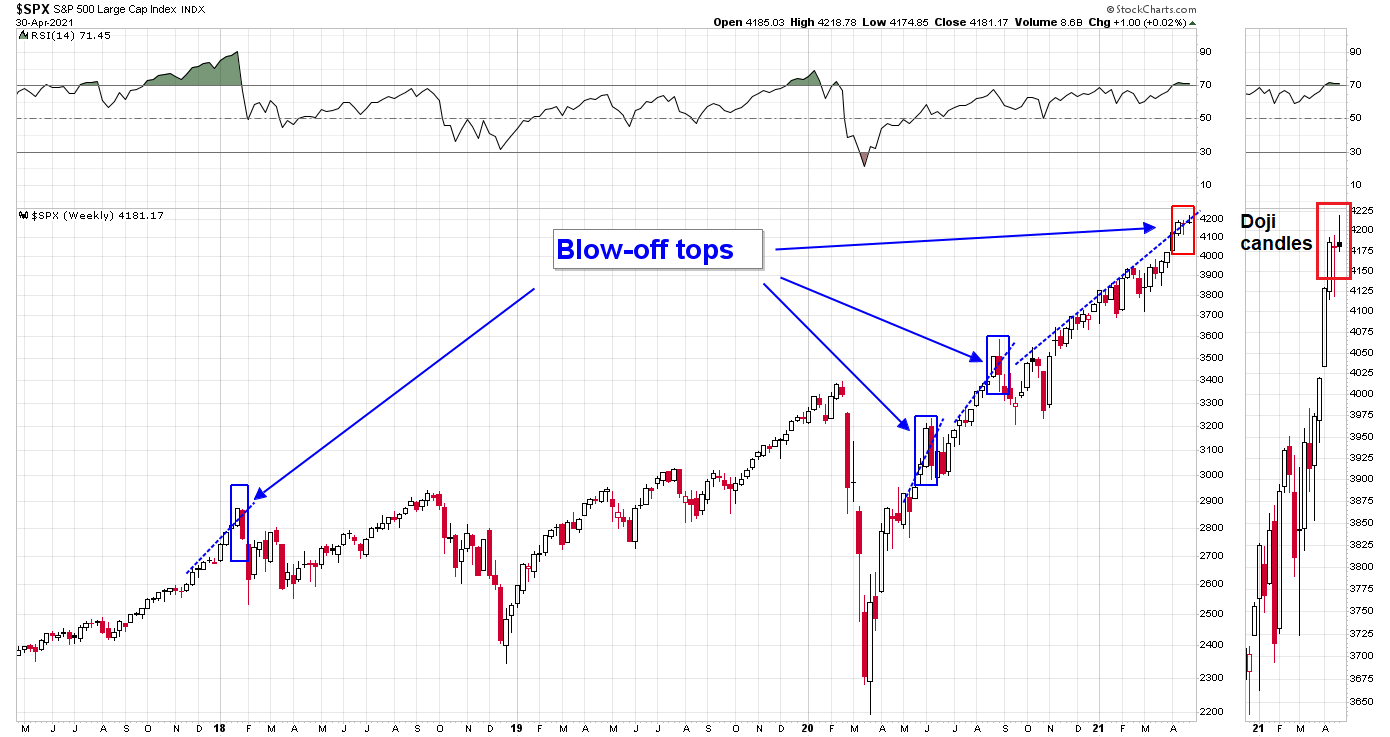
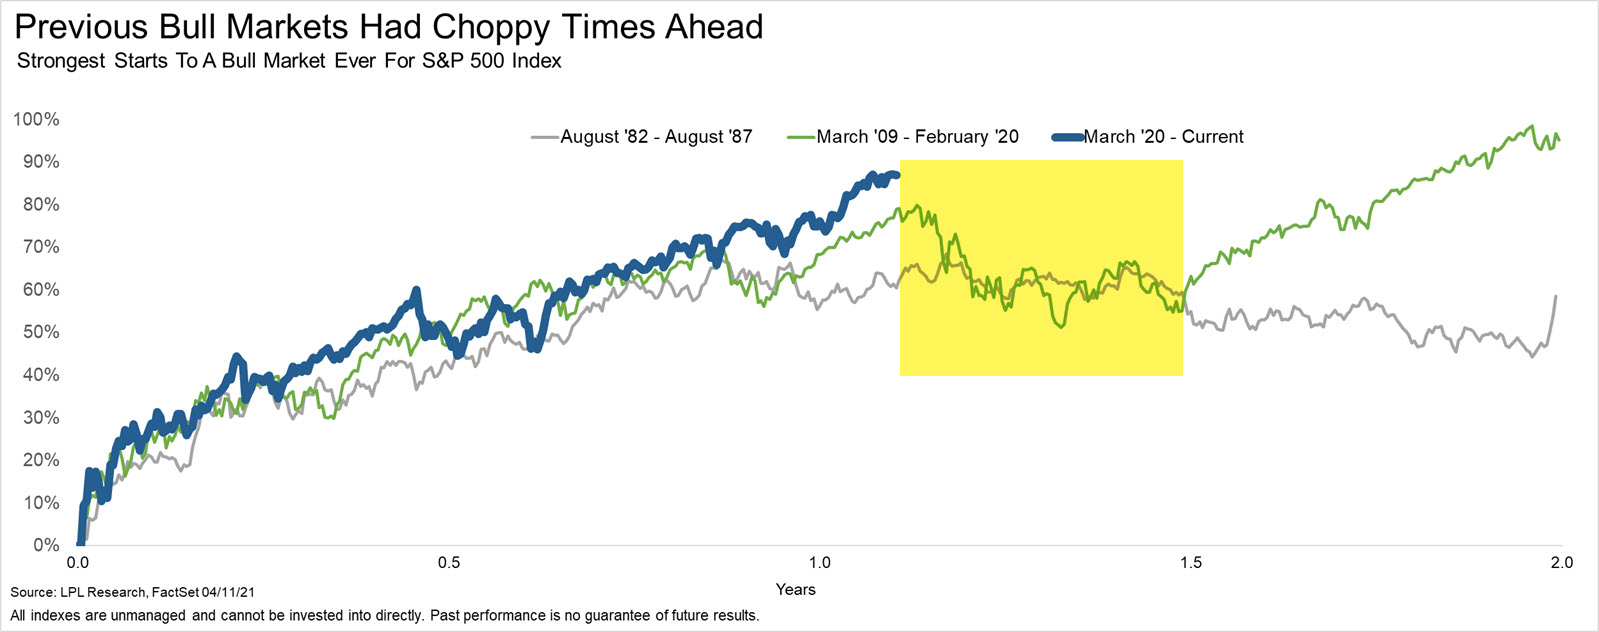
A tiring bull
It’s the 10th anniversary of “Margin Call” and yesterday I hosted a live chat with its director, J.C. Chandor, as well as Citigroup strategist Matt King. The film traces a blow-up at a big bank that’s reminiscent of what happened in the 2008 subprime crisis. King famously penned a research note just before the collapse of Lehman Brothers, arguing that the big problem for U.S. banks was short-term funding secured by subprime and other collateral.
In “Margin Call,” the bank’s senior executives don’t realize they’re sitting on a powder keg until a junior risk manager stumbles on the numbers by chance. That scenario always seemed a little far-fetched to me, but King brought up some anecdotes from 2008 that showed just how much senior leaders seemed to be unaware of the scale of the problem they faced. As he put it:
“I myself remember having a conversation with desk heads in early 2008 on CDOs of asset-backed securities, and they were being relatively incredulous at the idea that if the junior tranches went, the whole structure was likely to go (I actually wrote another research piece that hardly anyone remembers!)”
So how much has changed on Wall Street in the past decade? We recently saw banks handle another — albeit much smaller — blow-up in the form of Archegos. There were huge losses from that but no broader contagion, a testament to post-crisis regulation on capital and leverage. Is the system safer? King argues that there are some things that give him pause in the current environment, notably the March 2020 drama in the world’s biggest funding market:
“More subtly but just as importantly, what the periodic bouts of illiquidity in Treasuries are suggestive of is investor herding. The real recipe for a liquid and stable market is a heterogeneous market: Buyers and sellers, bottom-up investors and top-down investors, mark-to-market investors and buy-and-hold investors.
Somehow what we seem to have done post-2008 is to take a whole load of steps, which are individually designed to make the system safer, but collectively have killed off that heterogeneity and made for one-sided markets. The bottom-up, value-based, non-mark-to-market investor — they’ve been killed off by a decade of quantitative easing making everything more expensive and by regulators demanding everyone take a risk-based approach to capital. That gives you a market in which investors get herded into a broad-based reach for yield that they don’t really believe in. And that gives you those pockets of illiquidity: We don’t get one and two-standard-deviation movements any more — we either get zero or we get 16.”
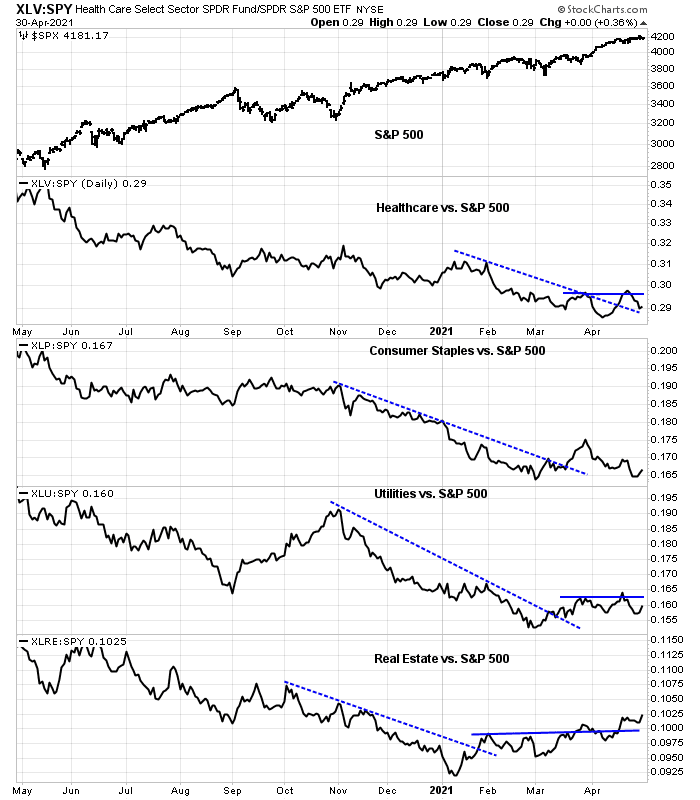
Weak, but not catastrophic
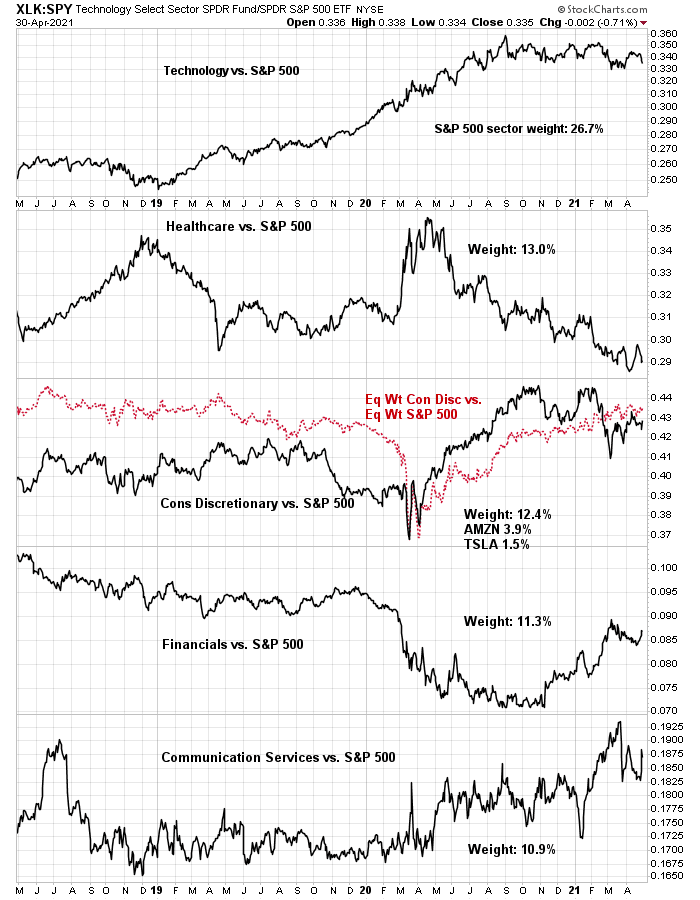
On a relative basis, defensive sectors are not acting well, indicating that the bears haven’t seized control of the tape.

In my opinion, Clean Energy is the poster child of the Innovative Growth sector. It attracts investors of all types. Who doesn’t believe there will be huge spending with across-the-world government supported infrastructure projects as we move to electric vehicles and renewable energy? It seems like a guaranteed winner and likely will be.
This is similar to the year 2000 when it was obvious the internet was going to grow exponentially and change the world. It did but the stocks were valued at stupidly high valuations that even the most successful companies’ stocks (as in CISCO and Microsoft) going down for many years.
As a student of bubbles for forty years, I can tell you that they keep inflating by having a great idea (like green energy transforming the world) and stocks that keep on going up and proving naysayers wrong as they go stupidly higher and higher.
The trick is to keep on going higher (Bitcoin is doing it). Once the bubble bursts due to absurd valuations and everyone that would buy into the concept is on board, the tide goes out with lower and lower levels of stock prices. The stocks have temporary support levels because the narrative of the bubble is still very valid but the valuations are still absurd and even insiders and underwriters (and SPAC entrepreneurs) see the game is over.
So it’s critical for Cathie Woods and her successful followers to push stocks higher and once again prove the skeptics wrong or unfortunately the naysayers will finally be right.
If the innovative bubble pops, I hope and expect it doesn’t take down this young Value bull market. Who the hell will want to own a bond instead of a stock when Powell and Yellen have your back?
Personally, I would watch the VIX, VXN and RVX (volatility indexes). All of them have or are close to breaking their down trend lines. Also, they are making higher highs even though SPX made a new high. A non-confirmation.
Also, the semi-conductor index (which is a huge tell) has not confirmed the new high in the Nasdaq or the SPX. In fact, it is in the process of making a complex top or a head and shoulder’s top.
All worrying signs. One has to be patient or buy out of the money puts on the Semi- Conductor index. I would wait till the FAT LADY SINGS!
I wonder if the vacation from reality will end when the stimulus checks are done and the US has reopened and guess what, things are not great, there still is a lot of debt and a lot of people with no jobs or low wage jobs, and those zombie companies start defaulting or declaring bankruptcies. Or they toss 20 trillion at the economy, what’s another zero? My big worry is that things happen very very fast.
Slowly but surely, inexorably, the world is moving towards clean energy, de carbonization of industry and other ways to reduce Greenhouse emissions. Some may not agree on it’s need or pace of change. Some may resist it due to economic consequences. One may bury their heads in the proverbial sand, but that will not change the progress.
There are some well established technologies that will find wider acceptance. Some are new and will take more work and time (solid state batteries). Does anyone doubt the unique combination of science, capital and policy support will not solve the challenges. Many companies will fail but even in failure add to the scientific knowledge.
I bet on the bright future for investments. Airlines and other such sectors will have a day or two in the sun.
Think of 5G, Internet of Things, Genetic sequencing and editing (technologies used recently in vaccine) and many other examples. Label them Innovative Growth or something else. It does not change the underlying premise. Cathie Woods has provided a great platform. I cheer her commitment and conviction.
The top companies stock prices ran up a lot into earnings. A pause post earnings is not a sign of exhaustion. They will continue their growth at double digit pace. Market will catch-up.
There are cyclical sectors that do better in expanding business cycle. A growth company in such a sector would probably do better than a value company.
I just want to add to maximum confusion and randomness. Katherine Griefeld of Bloomberg reported that 25% of TLT are sold short based on most recent data. Today TLT’s share price is about that in Oct 2019. Think about it. Can this be viewed as a contrarian signal? If it indeed is proven to be contrarian, then all prevailing positioning will be reversed. So staying balanced is prudent.
https://www.yahoo.com/finance/news/warren-buffett-zero-interest-rates-have-created-a-sea-change-in-finance-125816914.html
Warren Buffett’s statement needs to be corrected. It is zero to negative interest rates, if truth be told.
Cam- Are you still thinking the S&P will correct 5-10%, or has your opinion changed?
If it doesn’t correct 5-10%, at a minimum expect a period of sideways chop and consolidation. The correction scenario is still my base case though.
Scanning through the ISM manufacturing report commentary this looks like an economy trying to accelerate out of a slump but hitting some early speed limits. A lot of capacity expansion investments that should have happened 2-3 years ago are only just being announced now, but this global economy was being held back by trade uncertainty and a pandemic. The commentary in the report indicates that demand will continue to be strong in Q3.
Taking a swing at KRE on the pullback to 68.2x.
QS/ PLTR/ VIAC/ DISCA/ RIOT on pullbacks as well.
Buffett sees inflation, which may be driving GDX.
AMZN.
Out of RIOT. Out of KRE.
Stopped out of AMZN.
The Nasdaq is setting up as a decent-odds short.
Out of all positions for a minor loss.
Great barometer for the positions I’m trading.