Mid-week market update: Bloomberg recently featured an unusual article titled “Sell Signals All But Useless in Unchartable 2021 Stock Market”.
If you bailed because of Bollinger Bands, ran away from relative strength or took direction from the directional market indicator in 2021, you paid for it.
It’s testament to the straight-up trajectory of stocks that virtually all signals that told investors to do anything but buy have done them a disservice this year. In fact, when applied to the S&P 500, 15 of 22 chart-based indicators tracked by Bloomberg have actually lost money, back-testing data show. And all are doing worse than a simple buy-and-hold strategy, which is up 11%.
Of course, few investors employ technical studies in isolation, and even when they do, they rarely rely on a single charting technique to inform decisions. But if anything, the exercise is a reminder of the futility of calling a market top in a year when the journey has basically been a one-way trip.
“What we’ve seen this year is a very strong up market that didn’t get many pullbacks,” said Larry Williams, 78, creator of the Williams %R indicator that’s designed to capture a shift in a security’s momentum. A long-short strategy based on the technique is down 7.8% since the end of December.
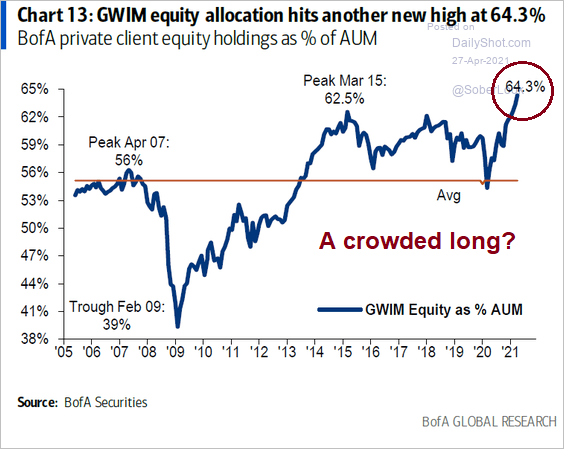
Sell signals have failed. Much of this can be explained. Some, like this sentiment signal from BoA’s private client holdings, indicate a record crowded long in equities which is contrarian bearish. However, how much can investors allocate to fixed-income instruments in an era of low and rising rates? Stocks are the only game in town, even for income investors.
The straightforward view is the strength of momentum has overwhelmed all other technical signals.
Waning momentum
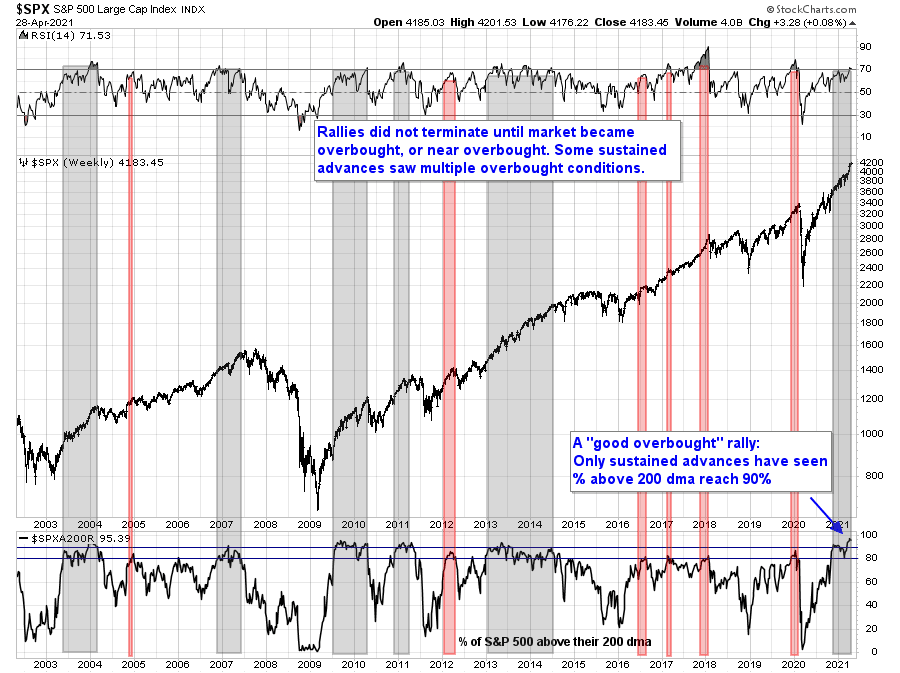
Another way of explaining momentum is “good overbought” reading. As good technical analysts know, no reversals are guaranteed. Overbought conditions can get more overbought and oversold. conditions can get oversold.
We are reaching conditions when momentum is starting to wane and sell signals may be about to become more effective. The percentage of S&P 500 stocks over their 200-day moving average (dma) exceeded 90% in November. This was a “good overbought” condition indicating a strong and sustained advance. In the past, the rallies did not pause until the 14-week RSI reached an overbought reading of 70 or more, which was achieved in late March. That was the first warning.
The second warning occurred when the S&P 500 overran its rising trend line on the weekly chart and recycled, which were indications of blow-off tops.
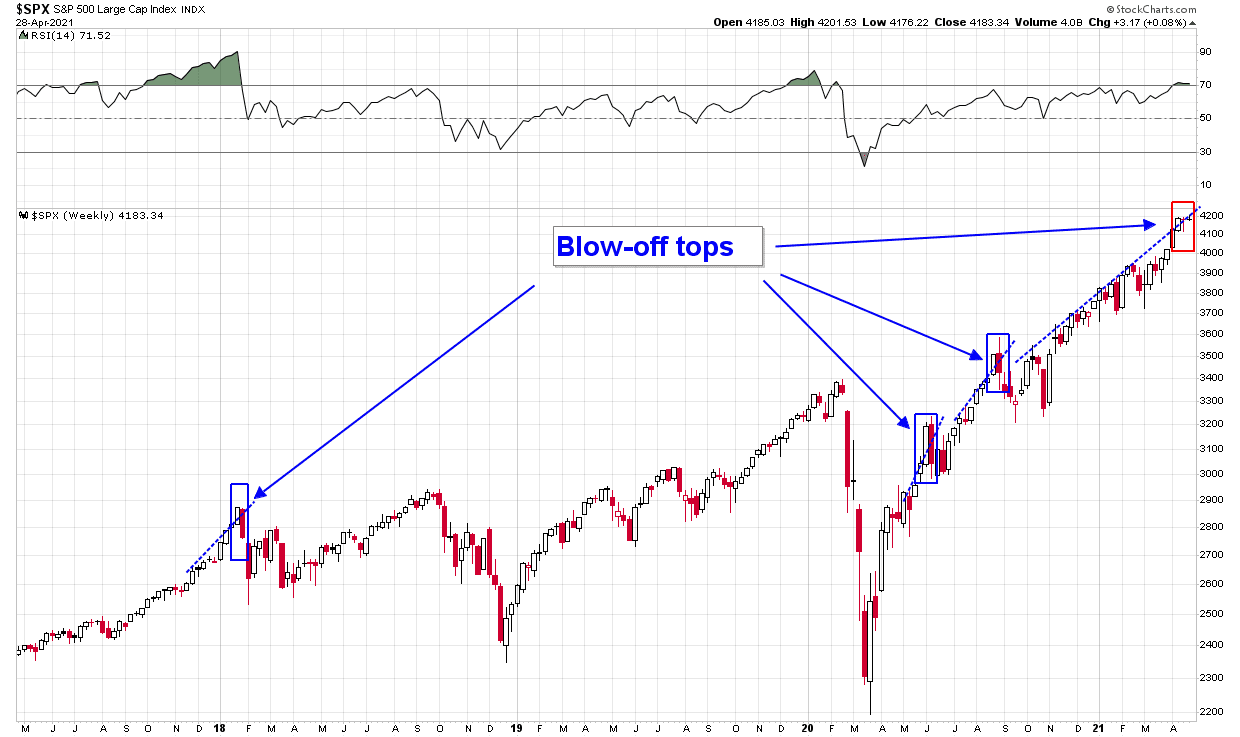
The daily chart also showed an ominous negative divergence. Even as the S&P 500 made daily marginal all-time highs, both the 5 and 14-day RSI flashed negative divergences. While negative RSI divergences can persist for days before prices react, this was also another warning that the rally is its last legs.

Earnings season uncertainty
It’s always difficult to make short-term market calls on FOMC day. Daily uncertainty is especially problematic when the market is in the heart of Q1 earnings season. On Monday, Netflix missed subscriber growth expectations, and the stock fell after the report. On Tuesday, both Microsoft and Alphabet beat Street expectations. Microsoft fell while Alphabet rose. Even AMD, which reported and came out with extremely strong guidance, saw its stock price retreat. Today (Wednesday), Apple and Facebook beat expectations and rose in the after hours.
You can tell a lot about the character of a market by the way it reacts to the news. Even though results have generally been positive, the market reaction has been mixed though not disastrous.
I have found in my trading experience calling tops and bottoms to be an expensive coin toss. More so, because the volatility at the tail end of a rally or a selling climax can be very expensive to one’s trading capital not to be mention nerve racking. It is far easier once the top is in to use some short term moving average to initiate a trade. The stop then can be the previous high or low. Some traders also use VIX with Bollinger Bands to confirm a change in trend.
I hope this helpful.
I wouldn’t say that technical analysis has stopped working. TA is based on crowd behavior, and we all know that human nature hasn’t changed. Like everything else in the markets – there will be periods that frustrate any attempts at explanation or prediction. It’s just the nature of the beast.
I don’t usually chase on strength (and I never open positions in individual stocks ahead of an earnings release) – but I’m opening a position in AAPL after hours ~136 and change.
I considered adding second tranches to RYOCX/ RYPMX/ RYGBX near the close, but decided against it. Odds are I’ll be closing all three positions tomorrow or Friday.
In the Dotcom bubble, the nasdaq blew up through the upper channel for that last massive spike. At that time the margin level also blew up in a similar fashion.
Now we have spx blowing up through the upper channel (draw a line through the sept 18 top and the 2020 top in feb) and margin levels are doing the same thing. That’s why I said what about 2 months ago a blow up and we could see six at 5000….which is crazy.
It makes me wonder if there is like a Ponzi scheme going on….all this money creation, some of it went to companies raising cash….cash that may be being used for buybacks which benefits insiders.
They say that stocks for example can stay overbought for a long time, case in point perhaps.
I wear beat up old Uggs so I won’t have the benefit of a shoeshine boy, and I don’t Uber.
When the insanity in 1999/2000 happened it went on for a good 6 months….my plan is to watch and from time to time buy way out of the money SPY puts of long duration, ditto SPXS when the crashing goes crazy.
The money printing will continue until the system breaks, I think that will take a long time. It will have to be a political issue, and I think we are far off from when people will protest getting free money from the gov’t.
So we will get a bubble that bursts, and more money when that happens….the gov’ts have no choice, it’s either print or have the pandemonium of a revolution.
The low of 2174 on the ESmini, and the crossing of that line at 3600, you often see the same amount to the upside, that’s why I said 5000.
I prefer fundamentally sound stocks, that have a price which is rational to earnings, but we have phenomena like Gamestop, workhorse, Koss.
TSLA has sold about 1 million cars, a market cap of approx 650 billion, so 650,000 per car sold over the last 15 years….makes no sense, but this is where we are
The reason technical analysis hasn’t worked since last November is simple. The vaccine announced November 9 was 95% effective and could be manufactured faster than anyone thought possible. Before the announcement we were expecting a 50 to 60 percent effective vaccine that would be made with egg yokes (Just exaggerating on this part but some much slower process). So we could expect herd immunity soon rather that uncertainly years into the future. Just think of how different these two futures were the day before November 9 and the day after.
So we set off a powerful, once in a lifetime, momentum stock movement that still (in my opinion) is in force. Why the hell would there be RSI Bollinger or other technical pullbacks when investors were waking up to the powerful economic tsunami that is heading our way. Bloody manufacturers are scrambling for parts to fill unexpected demand.
Technical analysis works when the market is basically in balance with a background of a normal expanding economy but is somewhat higher or lower than it should be (other than a bear market). The last period of time is not that. It has been a totally one dimensional super bullish economic surge.
I looked at the ratio of MTUM to RSP this morning to see if I could get some idea as to whether the momentum wave was still in effect. The 200 day ma peaked in November and has been in decline since. My preliminary conclusion was that momentum is off for the moment, but, unlike you, I’m no expert. I understand the economy is strong but the stock market is not the economy and so was wondering whether there are other factors you are considering which also motivate your conclusion?
misspoke myself, make that 50 day ma.
Cam, aren’t you overthinking this a bit? You have trillions in fiscal stimulus, zero interest rates and QE. People need a reason to sell/change asset classes. That fear is surely going to be dialling back of stimulus or the fear of it. Seems like that will arrive end May at the earliest. Correction will be severe then, obviously.
I’m a net seller today – beginning in the premarket session that opens in a few minutes, and throughout the day.
The plan to is to sell strength. If opportunities to buy ensuing weakness present themselves, I may opt to reopen only to close by end of day.
I plan to be back in cash by the close.
Closing VIAC/ DISCA.
Paring back on QS.
Paring back on NIO.
Reducing QQQ by half.
Cutting exposure to AAPL. Even an overnight gain of just +0.8% is still a gain.
Cutting back on X.
Good chance many will be selling into an opening gap up – which may present another buying opp.
Paring back on KRE.
Closing JETS.
Closing TSLA.
Adding back to AAPL @ 135 and change.
Closing KRE.
Reopening QS.
Adding back to X.
Reopening NIO.
Looks like I should have closed the miners yesteday!
They sold the opening gap.
Now we’ll see if dip buyers show any interest.
Normally the miners would be hitting some kind of mental stop here – but because I averaged down on Wednesday morning, the positions are currently in the red by ~-1% and I’m going to give them a chance to recover. I plan to be out by end of day regardless.
All positions off here.
This is not a friendly tape. Preserving the gains I (still) have at this point – which are quite a bit smaller than they were an hour ago.
Will the morning selloff be the pause that launches a late-day rally? That’s a real possibility.
Reopening MSFT/ AAPL.
MSFT/ AAPL off.
The nice thing about clearing the table is that it also clears your head.
I’m just not seeing much in the way of positive action right now.
Still holding three down-sized positions in RYGBX/ RYPMX/ RYOCX.
AAPL now red.
A late-day rally it is. No plans to play it – I’m just hoping for enough upside in TLT/ GDX/ QQQ to keep any remaining losses to a minimum.
I didn’t manage the morning reversal well – should have locked in gains within the first 5-10 minutes.
AMZN.
I’ve posted all my trades in real time, except for this one. Took a flyer on AMZN at the last minute as my sixth sense forced me into action. Nothing big – just ten shares.
Closing the trade now.
I closed @ 3637. Looking for another entry, as I believe price discovery has yet to really kick in.
AMZN needs a stock split.
3585->3621.
Done.
Sometimes it all comes down to luck.
Took hits on RYGBX and RYPMX. Of course, today’s losses are offset by yesterday’s gains.
And today’s gain on RYOCX simply reverses yesterday’s loss for a flat trade.
Now 100% cash.
Percentage of S&P 500 stocks over the 200 day moving average at 94.59% this afternoon, a very extended reading.
Now at 96.944 (3:13 EDT), the highest in the last 20 years. It was nearly as high In 2004 for a period of 3 months or so, In the latter half of 2009, coming off the great recession, for a period of ~6 months or so and in 2011 for about 4 months . So it can continue for a fairly extended period of time before it corrects.
Taking another stab at AMZN under 3500.
And closing for a small gain.
And another shot ~352x.
And off again.
There seems to be strong demand for AMZN at current levels. Opening another position ~353x.
AMZN off here for a loss.
AMZN ~351x.
AMZN back below 3500. So much for strong demand. However, it’s one of the few greens in a sea of red.
Adding a bit @ 350x.
Still with the position, but at this point in the red on my intraday trades. It’s a barometer of sorts – this was the best trade I could identify this morning, yet has failed to gain any traction apart from a brief morning run.
Taking the hit here ~3478x. Respecting the price action, and with I have absolutely no longer-term reason to stay with the trade.
Healthy pullback today in an ongoing bull – or the beginning of one?