Preface: Explaining our market timing models
We maintain several market timing models, each with differing time horizons. The “
Ultimate Market Timing Model” is a long-term market timing model based on the research outlined in our post,
Building the ultimate market timing model. This model tends to generate only a handful of signals each decade.
The
Trend Asset Allocation Model is an asset allocation model that applies trend following principles based on the inputs of global stock and commodity price. This model has a shorter time horizon and tends to turn over about 4-6 times a year. In essence, it seeks to answer the question, “Is the trend in the global economy expansion (bullish) or contraction (bearish)?”
My inner trader uses a trading model, which is a blend of price momentum (is the Trend Model becoming more bullish, or bearish?) and overbought/oversold extremes (don’t buy if the trend is overbought, and vice versa). Subscribers receive real-time alerts of model changes, and a hypothetical trading record of the email alerts are updated weekly here. The hypothetical trading record of the trading model of the real-time alerts that began in March 2016 is shown below.
The latest signals of each model are as follows:
- Ultimate market timing model: Buy equities
- Trend Model signal: Bullish
- Trading model: Neutral
Update schedule: I generally update model readings on my site on weekends and tweet mid-week observations at @humblestudent. Subscribers receive real-time alerts of trading model changes, and a hypothetical trading record of those email alerts is shown here.
Subscribers can access the latest signal in real-time here.
Sell in May?
Is it time to sell in May and go away? Market internals are starting to look wobbly. The relative performance of the defensive sectors is flashing warning signs. Two of the four sectors are testing relative breakouts, and the other two are consolidating sideways after rallying out of relative downtrends.
If the market does weaken, where can investors hide?
A vulnerable market
A number of risks are emerging that makes the US equity market vulnerable to a setback. The S&P 500 recently exceeded the Wall Street strategists’ Bloomberg survey average target of 4130. With the exception of the 2017 tax cut related ramp and the 2020 rally, when the Street was chasing market expectations, such episodes have been followed by market weakness or a period of sideways price action.
Sentiment survey readings are becoming very stretched. Investors Intelligence sentiment is at a crowded long condition.
So is the AAII survey. While giddy bullishness is not as effective as a sell signal compared to panicked sentiment as buy signals, the stock market has often encountered trouble advancing when sentiment was this bullish in the past.
Equally disturbing is the negative divergence between the AAII sentiment survey, which measures the sentiment of individual investors, and the NAAIM Exposure Index, which measures the sentiment of RIAs. While both indicators are normally used on a contrarian basis, past negative divergences when have resolved with market corrections.
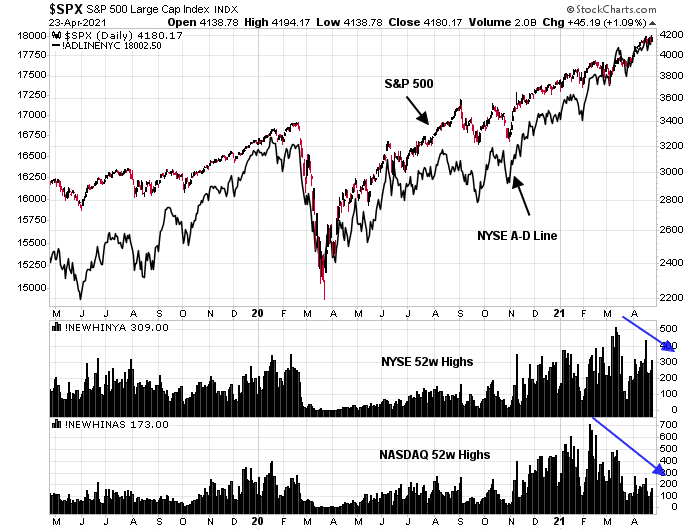
I am also seeing negative breadth divergences. While the NYSE Advance-Decline line is confirming the strength in the S&P 500, NYSE and NASDAQ new highs are not.
On their own, none of these indicators are immediate and actionable sell signals. In fact, there is a possibility that the S&P 500 could grind its way to another high in the coming week. If we put all these indicators together, they form a picture of a vulnerable market that is poised for a setback.
Estimating downside risk
What’s the downside target for the S&P 500? It’s difficult to make a projection without knowing the bearish narrative, which hasn’t emerged. That said, initial support can be found at the 3970-4000 level, which coincides with a rising trend line and the 50-day moving average (dma). Further support can be found at the 200 dma at about 3620. My working hypothesis is a peak-to-trough pullback of 5-10%.
Traders should look for some of these signposts that the market may have bottomed, with the usual caveat that oversold markets can become more oversold if the market panics.
- An oversold 5-day RSI reading.
- The VIX Index spiking above its upper Bollinger Band.
- An inversion in the term structure of the VIX, which is an indication of rising fear.
- An oversold condition on the NYSE McClellan Oscillator.
Currently, none of these indicators have flagged a bottoming condition. (Market bottoms are like pornography. I’ll know it once I see it.)
Gold stock: Negative beta plays
In a market pullback, there are few places to hide as virtually all stocks will fall in concert with the market. These opportunities were identified two weeks ago, but they bear repeating (see
Internal rotation + Seasonality = More gains).
Gold mining stocks (GDX) represent one of the few exceptions of a class of equities with negative beta, or stocks that are negatively correlated with the stock market. GDX recently achieved an upside breakout through a bull flag, and the GDX to gold ratio also exhibited a similar upside breakout. Gold bullion, however, is a laggard and it has not broken out to the upside yet.
The point and figure chart of GDX shows an upside target of roughly $40, which represents an upside potential of 11% from current levels.
Treasuries as safe haven plays
Another asset class that has shown a negative equity beta is Treasuries. The 10-year Treasury yield broke a rising trend line and rolled over while exhibiting a negative RSI divergence. (As a reminder, bond prices are negatively correlated to bond yields. As bond yields fall, bond prices rise).
My concern is the yield reversal has the appearance of a bull flag, which is a bullish continuation pattern indicating that the primary trend in yields is up. Nevertheless, the first Fibonacci retracement level for the 10-year yield is about 1.4%.
A point and figure analysis shows the same target of 1.4%.
In conclusion, the stock market has become increasingly vulnerable and a pullback may have already begun. None of the bottoming indicators have flashed any alerts, which indicates that the lows are not near. Expect some volatility in the coming week as there is an FOMC meeting and major tech companies report earnings. In the near term, traders may be able to find some tactical refuge in negative beta assets such as gold mining equities and Treasuries. My base case scenario calls for a 5-10% correction. Investment-oriented accounts should view market weakness as buying opportunities.


I need your help Humble Students.
As a Canadian, I really do not understand your healthcare system but a couple of ETFs in that industry are showing signs of life.
My old favorite, Medical Devices IHI is still not a momentum buy by the rules but it’s starting to move. I’m thinking that with Covid hospital admissions falling, elective surgeries can now be scheduled. There must be a huge backlog in knees and hip replacements. Also, remote medicine equipment must have gotten a boost from the lockdowns. Does that narrative make sense for this perennial winner to get its mojo back?
The other is Healthcare Providers ETF IHF. It includes drugstores, hospitals and insurance companies (I think? Once again, I’m a Canadian). Once again, I’ve heard that hospital profits were hurt by Covid cases taking up space and (profitable) elective surgeries had to wait for the Covid cases to fall (as in like now).
Do these make sense as new groups to have legs?
I note that Cam says the Healthcare index is starting to outperform.
BTW Pharma ETF XPH sucks on a momentum basis.
As Covid was ravaging in the US, most hospitals were given printed money. I suppose the device makers may have also benefited in a similar fashion. Yes, routine surgeries etc. were deferred, but now, this sector should experience reflation effects.
Similar downturn was seen circa 2008, and an upturn several years thereafter.
I am a retired physician and have practiced in Canada and in the USA. My wife currently is a nursing director in a US hospital.
The most important things to consider are,
1 Remuneration for care, it is not based on length of stay, it’s bundled, so you get so much for say complicated pneumonia, but this in no way covers the cost of a lengthy stay for Covid. Short version, the hospitals got clobbered, what saved them was CARES act money.
2 Surgery for hips or whatever that has a predictable length of stay and complications will make money and my guess is that these will benefit from pent up demand once hospitals open up and people fear hospitals less.
3 Big ticket items like MRIs etc, the hospitals are broke, things that had been budgeted for 2 years ago are still on hold. I think the hospitals will need to repair their balance sheets before they start buying those items or systems.
4 Healthcare insurers, this I don’t know much about in terms of impact. Drug costs can be brutal. With all the lost jobs, how many have dropped off the roles? Were they younger less costly covered lives?
5 Speaking of insured lives, how many have lost insurance and now may show up at the ER with no insurance and a non-Covid emergency? The hospital gets nothing for this, has the percentage changed? Those checks sent out to people did not include health care unless I am mistaken, so what will happen as Covid hopefully fades away?
6 Too big to fail was applied to systemically important banks ( which of course they have not fixed), I would think that the aggregate of US hospitals is too systemically important, so I hope that if they continue to struggle they will get more money. Imagine hospitals closing down in the DC area, they might notice. Cynicism aside, a few hospitals in trouble would most likely be ignored, but the majority of them verging on bankruptcy would not.
But shares of ISRG have spiked higher, so what do I know? Of course, ISRG may be benefitting from a surge not of the Davinci sales but of all the costs of maintaining them, and the disposables that go with them.
Routine surgeries should bounce for conditions that persist, like hips, knees, pelvic pain etc.
I can tell you that many times I have thought “Thank God I don’t have an office to run, it would be a nightmare”
Hi Ken- If you don’t feel it is too proprietary, would you please go over the metrics you use to determine momentum and buy/sell points for momentum stocks? I would quite understand if you didn’t want to do so and wouldn’t want you to give away anything you feel is confidential info. I am just trying to increase my understanding level to get past the stage of being a journeyman market technician. Thanks in advance!
RAS
Cam -Are you using +35 and -25 as the trigger points on your AAII bull/bear difference chart??
Thanks,
RAS
More or less. The sell signals don’t work well unless they are *really extreme*, which is rare.
As far as where to hide. I know this is trading discussion day, but there is always cash. When things look iffy, get away from the table. The many faces of FOMO.
But if you are trading a small amount, and it keeps you happy is different. Small amounts engender only psychological FOMO (at least for me, because no matter what happens it won’t change anything other than annoy me if it blows up in my face)
A few data points:
1. Couple of surgeons we know closely are very busy again.
2. It is hard to get quick appointments with some specialists-gastro physicians who do lot of routine procedures etc
3. Traffic into physicians office is improving but still below pre-pandemic levels.
4. Most States provide expanded Medicaid eligibility. Access is less of an issue than a few years ago.
I am of the opinion that medical devices sector (IHI and XHE) will do well in coming months. I am positioned accordingly.
I am a lazy person who does not spend a lot of time doing fundamental research like before. Instead I adopt a medical science approach: using biomarkers to gauge the state of things.
OK: ISRG, STAA, SWAV all going up big together, what does that tell you about the money flow? They are in the electives. One, not sure. Three, more than likely odds in your favor. Another biomarker I use: WST. It tells you the activity of medical industries. And watch NVCR. It potentially can be a huge company.
I agree with yodoc2003. Cash is a position.
In fact, it’s a TRADING position. When markets sell off hard, it’s the ultimate asset – not only do you have the means to buy when others are are in distress, cash also helps you maintain an even keel.
Strongly agree with that! If you have cash in a big decline, you’ll be able to pick up all kinds of bargains. `Awhile back, I bought XOM during a big decline and got a 10% dividend stream plus about a 70% gain in a little over a year. I’ve sold all my growth etfs and am about 40% in cash waiting for a buying opportunity. Not wishing anything bad for anyone else, but I’m hoping to find another XOM or two and a good buying opportunity to pick up some quality etfs on sale.
More support for the value thesis:
https://www.zerohedge.com/markets/qqq-etf-sees-biggest-outflows-bursting-dot-com-bubble
If the interest rates decline as posited before and Covid-19 is not controlled soon (unlikely outside the US and China), maybe the large tech and growth will have one last oomph before Value really takes over.
Mike Wilson from Morgan Stanley says PMIs are peaking out here and we are moving mid-cycle, where investors should prefer Quality. So indeed investors are jumping back into US tech megacaps and are willing to bid up those expensive names again. I would at least expect MSFT and GOOG to outperform in Q2, other names may be more vulnerable, see NFLX earnings reaction. INTC earnings reaction is a bit of a tell that investors are less forgiving and willing to overlook mixed/disappointing near-term results.
From a contrarian viewpoint, that’s a very real possibility.
Most rallies will retrace to test investors (aka a retest) – with value over growth now the consensus play, I would expect the market to shake the value tree. Just the reverse for growth – in fact, one could argue that the -10% correction in the Nasdaq (not to mention the -50% moves in ARKK stocks) might constitute the requisite shakedown prior to new highs in May.
GDX has retraced to last Monday’s levels. Scaling back in premarket.
PLTR/ IQ.
DISCA.
GDXJ.
NIO.
RIOT.
VIAC.
FXI.
Adding second tranches to most positions.
Scaling into TSLA.
ARKK.
COIN.
JETS.
Closing ARKK.
Closing TSLA.
Paring back on QS.
XLP (consumer staples).
AUPH.
XLI.
QQQ.
VTV. Intraday low, if you’re looking for an entry into value today.
Scaling back into KRE here.
Closing NIO.
Closing IQ.
Closing DISCA.
Closing QS.
Closing both GDX and GDXJ – those trades are not working today.
Closing VTV/ XLI/ KRE – those trades aren’t working either.
Adding to QQQ, which is working.
Closing XLP.
Adding to FXI.
Reopening TSLA.
Reopening QS/ PLTR/ NIO.
Adding to RIOT/ COIN.
JMO, but it appears that the scenario suggested by Sanjay is underway.
All positions off here.
I began the day with a 50/50 take that either GDX/ TLT or QQQ would take off (or both simultaneously).
The value positions were losers, and I exited midday.
The growth positions were winners, and I added to them – nice moves in in most over the last thirty minutes.
Overall, I had only modest exposure but it was a fantastic day.
I don’t hold day trades into earnings, but I suspect TSLA may do well after hours.
Taking a swing at TSLA after horus – limit 725 hit. Will stop out if it falls to 720.
Stopped out.
Back in @ 720.
Just a hunch, but I think TSLA gaps up to 750 on Tuesday.