I have some good news and bad news. The good news is the option market isn’t as concerned about the prospect of a contested election. The chart below shows the history of the term structure of at-the-money implied volatility (IV). The latest readings shows that IV spikes just after Election Day, and deflates slowly afterward. The bad news is it took a -1.9% decline in the S&P 500 to invert the term structure to create this condition.

We can see a similar result from the IV of other asset classes. The chart below shows the at-the-money IV of gold (GLD), and long Treasury bonds (TLT), with the caveat that IV is not applicable to bond prices because and bond price volatility is not constant over time, though IV remains a useful shorthand for expressing volatility for option traders. The shape of the IV curves are all roughly the same across different asset classes. They all spike at the election, and fall off soon after.

That said, the threat of a disorderly electoral result is very real. Reuters reported that roughly 40% of Democrats and Republicans would not accept a loss by their side and a smaller proportion would resort to violence to assert their displeasure.
More than four in ten supporters of both President Donald Trump and his Democratic challenger, Joe Biden, said they would not accept the result of the November election if their preferred candidate loses, Reuters/Ipsos poll found.
The survey, conducted from Oct. 13-20, shows 43% of Biden supporters would not accept a Trump victory, while 41% of Americans who want to re-elect Trump would not accept a win by Biden.
Smaller portions would take action to make their displeasure known: 22% of Biden supporters and 16% of Trump supporters said they would engage in street protests or even violence if their preferred candidate loses.
Negative momentum ahead?
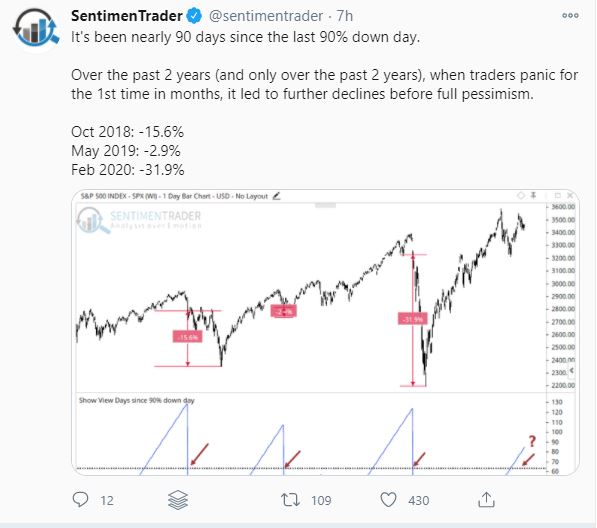
So what are to make of Monday’s price action. The market exhibited a 90.7% down to up volume day. Lowry’s interprets 90% down volume days as bearish, and they have to be negated by either a 90% up volume day, or consecutive 80% up volume days to turn the tape bullish again.
SentimenTrader also observed that recent initial instances of 90% down volume days have tended to be bearish, and resolved with downside follow-through. However, the sample size is small (n=3).
Does this mean that bearish momentum has the upper hand, and traders should pile in on the short side?
Positive seasonality
Bearish momentum, meet positive seasonality. Ryan Detrick at LPL Financial observed that the last four days of October is seasonally bullish, and October 28, which falls on Wednesday, has averaged the highest return for the year.

Bull or bear?
How should we react in light of these contradictions?
I wrote on Sunday (see How the Election held the market hostage) to watch the NASDAQ 100 because of its S&P 500 leadership. While the NDX did test its 50 dma, its relative uptrend remains intact, which is constructive for the bull case.

The market is undergoing a jittery phase that is highly dependent on newsflow. While the 90% down volume day is not to totally ignored, we are facing significant event risk ahead, both in the form of the election next week, and earnings reports from several FAAMG stocks this week. My working hypothesis is the current downdraft is temporary and could be subject to a reversal next week, depending on how the market behaves for the rest of this week.
Whatever happens, traders need to recognize that volatility is here, and they should size their positions accordingly.
Disclosure: Long SPXU
Cam,
According to Mr. Deemer, June 24 was also a 90% down day. STrader excluded that from his analysis.
“91% downside day. First 90% day since 91% downside day Jun 24. Need 90% up day or back-to-back 80’s to offset negative implications. Not foolproof; didn’t get back-to-back 80’s until Oct 7-8. “Always remember that we are dealing with probabilities, not certainties.” (Stan Berge)”
https://twitter.com/WalterDeemer/status/1320825316168916992
I agree with Deemer. No certainty in life. Stay flexible
https://twitter.com/realwillmeade/status/1320834551971778567?s=20
This blip in the stock market may be a head fake, in a larger move to the downside that may yet take place (Will Meade), depending on ones time horizon.
Furthermore:
https://twitter.com/sentimentrader/status/1320777010684350467?s=20
Putting a line through 3400 here on the countertrend rally.
Buybuybuy the day before election day.
Just like 2016. Piece of cake. No brainer.
Cam, I finally finished the super long Upside-Down Markets “paper” of OSAM. What he described made a lot of sense, it also supports your working hypothesis regarding the current downdraft.
He has always done terrific and detailed work. Reading the whole thing was exhausting and I had to do it several times. Well worth the effort
https://www.foxnews.com/politics/biden-plans-addressing-issues-from-climate-to-elder-care-approach-10-trillion-price-tag
The 40k word OSAM study is summarized well in 400 words give or take!
Cam, thanks for the analysis for short term traders. If, on the other hand your time frame is that of an investor, would you still see the 3200 level on the S&P 500 as a realistic possibility in this near term volatility? I ask this as I feel it would be a relatively good area to add to portfolios with a longer term perspective.
Thanks
https://www.marketwatch.com/story/most-investors-now-expect-the-us-stock-market-to-crash-like-it-did-in-october-1987-why-thats-good-news-2020-10-27?mod=home-page
Trimming NIO here.
Adding to XLE.
Trimming SNAP.
There is a bigger problem on the horizon;
https://www.yahoo.com/news/europes-second-wave-covid-19-121748051.html?guccounter=1
https://www.yahoo.com/news/sweden-puts-local-restrictions-malm-141142230.html?guccounter=1
https://www.yahoo.com/news/dutch-hospital-airlifts-patients-germany-130621251.html?guccounter=1
https://time.com/5903673/record-daily-coronavirus-cases/
(Depending on who wins on 3rd November), the US may be forced to lock down like it or not. I am not buying the idea it is blue sky from here in on. Just makes no sense to me.
but then lot of things made no sense to me anyways! Lol.
rxChen2, what happened to Wally who always used to laugh @ my silly jokes?
Wally is probably in a self imposed isolation until after the election. We all know about his political views.
I’ve been wondering the same thing.
One person’s opinion Cam. Something to think reflect about:
https://www.zerohedge.com/markets/david-einhorn-enormous-tech-bubble-and-it-popped-september-2-2020
David Einhorn has been in shorting tech (especially TSLA); isn’t this sour grapes?
It is a good idea not to reject an idea outright. Given the track record he has I would try to make sure I am not missing anything. Hence the question to Cam.
Taking minor losses on XLE/ BAC here.
Taking minor gains on EEM/ FXI.
Closing NIO/ SNAP.
Plan A right now is to close RYSPX end of day.
We may well see a strong rally tomorrow (ie, the strongest day of the year) – but I’m going to follow my trading rules and exit RYSPX at the close. Currently ~-0.65% off all-time highs, but also +4.3% since September 25.
Basically, a close below SPX 3400 negates the ST bull case for me. A retest of Monday’s lows is probably next.
The ideal setup for Wednesday would be to open deep in the hole – then reverse to print the best percentage move of the year.
And that’s in fact what the market has given us.
Were there any signals yesterday, other than the SPX close below 3400 – I would say the breakdown in XLF/XLE was another clue.
Scaling back into NIO/ SNAP/ PLTR pre-market.
BIDU/ BABA.
SNAP off. NIO add. NET reopen.
SPX may bounce off 3300 for a trade.
Reopening RYSPX at the 730 window. Sized down – 50/50 odds I’ll be able to add lower at the close.
Rescinding the order. I now think there’s a good chance we see SPX 3275.
The dollar index is breaking out which would portend a change in long term trend. If it holds al,l rallies should be sold. Next support at the 200 day moving averages of the indexes. Two downside days of 90% volume down is normally considered the start of something i.e. not a correction in a bull market.
Right. Maybe it’s time to either fasten our seat belts, or (perhaps smarter) pull off the freeway until the storm blows over.
The problem with days like this is that dip-buyers end up getting burned, which then fuels further selling.
In retrospect the semiconductor index weakness was the correct “tell” for this decline. It had started acting weaker before the NDX. Take a look at the chart. I had mentioned it to Cam a few days back.
Every bounce attempt has been sold.
Will reopen a downsized position in RYSPX at the close.
Starter position in QQQ.