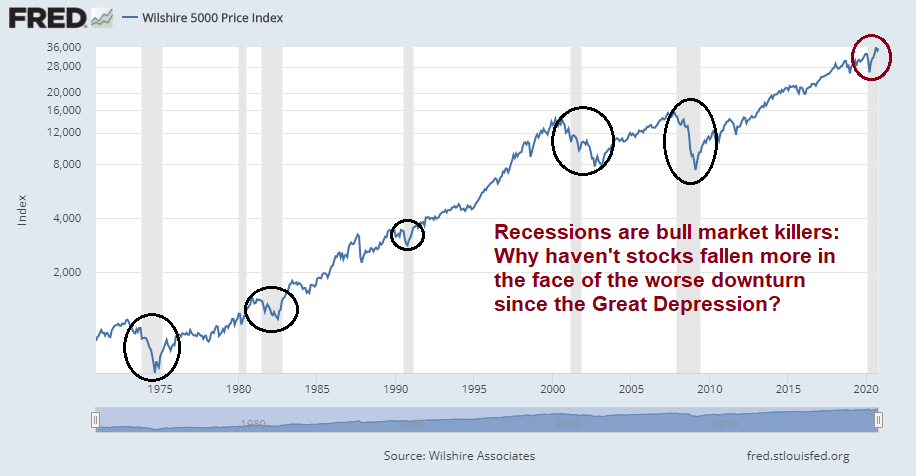
One of the investment puzzles of 2020 is the stock market’s behavior. In the face of the worst global economic downturn since the Great Depression, why haven’t stock prices fallen further? Investors saw a brief panic in February and March, and the S&P 500 has recovered and even made an all-time high in early September. As a consequence, valuations have become more elevated.
Three explanations


BIS: Insights from dividend futures
Financial markets recorded further gains during the review period, despite the challenging macroeconomic outlook. A divergence emerged between, on the one hand, elevated stock valuations and tightening credit spreads and, on the other, the reality of an economic recovery that looked incomplete and fragile. While investors did differentiate across sectors, rewarding technology stocks in particular, they seemed to be comforted overall by a stream of economic indicators that turned out better than feared. An accommodating monetary policy stance and news about new fiscal programmes in some jurisdictions also provided critical support for asset prices.
Stock markets overall saw a notable rise between July and early September. After recording strong returns in April and May, equity prices moved largely sideways in June but resumed their ascent thereafter. The gains were largest in the United States and China, whose main equity benchmarks by August had surpassed their pre-pandemic valuations, which had already carried signs of overheating (Graph 1, first panel). While other AE and EME stock indices recouped much of their March losses, they still remained some 10% below previous highs. A sell-off at the end of review period cut some of the early gains, particularly in the technology sector.
As part of the BIS study, Fernando Avalos and Dora Xia analyzed dividend futures on the S&P 500 and the Euro Stoxx 50 Index. Finance theory of discounted cash flows hold that equity prices is the sum of all future dividend payments, which are proxies for investor expectations of the fundamentals of individual companies in the respective stock indices.
Avalos and Xia found these dividend futures expiring in 2024 have rebounded strongly from the March bottom than contracts that expire in 2020. While 2020 is expected to be difficult, the long-term corporate earnings outlook isn’t expected to be as bad.

Avalos and Xia went on to observe that rates have plunged, the net present value of the 2024 dividends are worth much more than the pre-crisis period. Therefore the recovery in stock prices can be attributed to the combination of a strong rebound in long-term expected dividends, and falling interest rates. Had rates remained the same, valuations may be over 15% less than they are now.
While the authors don’t directly address the issue, this analytical framework also explains why growth stocks have handily beaten value stocks during the study period. Growth stocks normally don’t pay dividends, and finance theory holds that most of their value comes from their expected corporate value at a far off time in the future. This makes the duration of growth stocks higher than value stocks. (For the uninitiated, duration measures the sensitivity of an asset to interest rates. The longer the duration, the more sensitive the price is to interest rate movements.)
Indeed, the forward P/E ratio of FAAMG stocks have diverged from the rest of the S&P 500 far more in 2020 than the pre-crisis era.

While the BIS approach of studying dividend futures is useful from a finance theory viewpoint, it is unsatisfying from real-time investors’ perspective. Analysis from Goldman Sachs indicate that forward P/E ratios are relatively insensitive to differing inflation regimes – and inflation is a major determinant of interest rates.

Upside-down markets
A third, and more detailed, explanation of market conditions in 2020 comes from the writer under the pseudonym Jesse Livermore. Jesse Livermore has penned a number of very detailed and cogent analysis in the past, and the latest is no different. His latest Opus, “Upside-Down Markets: Profits, Inflation and Equity Valuation in Fiscal Policy Regimes”, was published by O’Shaughnessy Asset Management. The paper is long and extensive at over 40,000 words. He begins by describing an upside-down market:
An upside-down market is a market in which good news functions as bad news and bad news functions as good news. The force that turns markets upside-down is policy. News, good or bad, triggers a countervailing policy response with effects that outweigh the original implications of the news itself.
Here is a stylized though radical example of the events of 2020, though COVID-19 is not incurable and won’t last forever.
To illustrate with a concrete example, imagine a policy regime in which U.S. congressional lawmakers, acting with the support of the Federal Reserve (“Fed”), set a 5% nominal growth target for the U.S. economy. They pledge to do “whatever it takes” from a fiscal perspective to reach that target, including driving up the inflation rate, if the economy’s real growth rate fails to keep up. Suppose that under this policy regime, the economy gets hit with a contagious, lethal, incurable virus that forces everyone to aggressively socially distance, not just for several months, but forever. The emergence of such a virus would obviously be terrible news for humanity.
He went on to describe the economy, and the subsequent policy response.
The virus would force the economy to undertake a permanent reorganization away from activities that involve close human contact and towards activities that are compatible with social distancing. Economically, the reorganization would be excruciating, bringing about enormous levels of unemployment and bankruptcy. But remember that Congress is in-play. To reach its promised 5% nominal growth target, it would inject massive amounts of fiscal stimulus into the economy—whatever amount is needed to ensure that this year’s spending exceeds last year’s spending by the targeted 5%. To support the effort, the Fed would cut interest rates to zero, or maybe even below zero, provoking a buying frenzy among investors seeking to escape the guaranteed losses of cash positions.
The result would be bullish for equity prices, despite the horrible news about the economy.
If you are a diversified equity investor in this scenario, you will end up with a windfall on all fronts. Your equity holdings will be more attractive from a relative yield perspective, more scarce from a supply perspective, and more profitable from an earnings perspective. The bad news won’t just be good news, it will be fantastic news, as twisted as that might sound.
The rest of the paper takes a detailed journey through the drivers of corporate profitability, inflation, the interaction between fiscal and monetary policy, and equity valuation. He concluded that valuation equilibrium is unstable, and therefore equity prices could experience significant volatility [emphasis added].
Imagine that you are in a two-asset market where one asset, cash, earns nothing forever, and the other asset, an equity stream, earns $1 a year forever, with a portion of that amount paid out as a dividend and a portion reinvested to generate future growth. If you buy the equity stream for $10—an earnings yield of 10%—and the enthusiasm of buyers subsequently wanes, you won’t need to sell at a loss. If the price falls, it’s not a big deal, because the 10% yield that you be will earning on the investment is intrinsically worth the temporary loss of access to your money. All you will have to do is wait and let the earnings accumulate, either as dividends that get paid out to you or as investments that compound. Over the long-term, you will end up doing very well, regardless of where the market decides to take the price.
But now suppose that the price gets pushed up in a TINA chase to $100—an earnings yield of 1%. If you buy at that price, you’re going to have to remain laser-focused on the market’s subsequent response, keeping the position on a short leash and rapidly exiting if buyer enthusiasm starts to wane, because the 1% earnings yield that you’re going to be accruing is nowhere near enough to compensate you for the loss of access to your money, which is what you will have to endure if the price falls appreciably from where it currently is. If the market decides that it wants to assign a 20 P/E ratio to the security instead of a 100 P/E ratio, the price is going to fall by 80%. You’re going to have to wait a full 80 years to get your money back in earnings. Will the wait be worth the 1% spread over cash that you will have locked in? Absolutely not, which is why you’re going to have to pay close attention and make sure that you don’t get stuck in that kind of a situation.
In the same way that you are going to be more sensitive to drawdown risk as a buyer at elevated valuations, everyone else in the market is going to be more sensitive as well, which will make the prices themselves more sensitive, and the investments more risky.
Ultimately, the only way that a market can be stable is if everyone is more-or-less happy with what they are holding—willing to transact, but not feeling an urgent need to do so. In the hypothetical market above, is it going to be possible for everyone to be happy with what they are holding? Definitely not. If the equity price in that market is stable or rising, the underinvested individuals earning nothing in cash are going to be unhappy. They will want more equity and will chase prices higher until some counterbalancing disincentive emerges to discourage them, such as the disincentive of a needy, shaky, creaky market that looks and feels more expensive than it deserves to be. If the equity price is falling, then overinvested individuals taking losses in equities will be unhappy, and will chase prices lower in pursuit of the safety of cash, until prices get cheap enough to make the securities attractive as investments for their own sake, because the underlying cash flows are attractive, regardless of the price that they can be sold for.
In the end, TINA markets are guaranteed to be difficult and frustrating for large numbers of people. The problem of how to properly invest in them has no easy solution. Chasing ultra-expensive assets, nervously supervising them in the hopes that you haven’t top-ticked them, is stressful and unpleasant. But so is waiting on the sidelines earning negative real returns while everyone else makes money. Time is not on your side in that effort.
Based on the assumption that investors just want to maintain the pre-crisis allocations irrespective of valuation, he arrived at an S&P 500 target of 3900.
Returning to the subject of the current equity market, on the assumption that investors display zero sensitivity to valuation and invest entirely based on a pre-determined asset allocation preference, we can quantify the exact impact that the COVID-19 deficits would be expected to have on prices, if they found their way into markets. We simply assume that investors would bid up on the price of equity until their pre-pandemic allocation to equity was restored. To restore that allocation amid the COVID-19 debt issuance, the market would have to rise by roughly 18%, from its price at the time of the writing of this piece, roughly 3327, to a final price of roughly 3900, a forward 2-yr GAAP price-earnings ratio of 26 times.
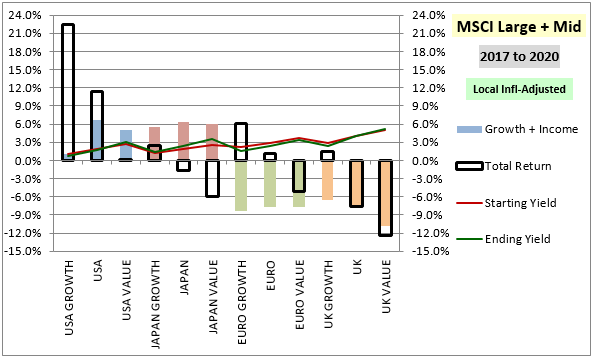
Stock returns by category from Dec 1976 to Dec 2019 for MSCI US, Japan, Europe ex-UK and UK indices, each separated into growth, broad market and value. Description and discussion below, to include charts of different sub-periods. Empty black boxes represent total returns, colored columns represent fundamental returns (annualized dividend growth w/ all dividend payouts recast as share buybacks). When a box is higher (lower) than a column, it means the category grew more expensive (cheaper) over the period.
He qualified the analysis by point out that Japanese fundamental improvement is distorted by the effects of Abemomics.
The depicted fundamental performance for Japan is distorted by the dividend payout ratio increases associated with Abenomics. If we were to measure growth in Japanese fundamentals using other aggregates (sales, earnings, etc.), the growth would not have been as strong.


I find this chart alarming. For US growth, you have ~22% annualized total return with only ~1% of that coming from fundamentals, the rest from valuation expansion.
The valuation question
- From BDO: The market was reacting rationally on a relative valuation basis.
- From BIS: The discounted value of dividend futures revealed that long-term cash flows had recovered, and lower interest rates boosted valuation. However, there may be some limits to the forward P/E to interest rate trade-off as forward P/E ratios have been relatively insensitive to low inflation and interest rates.
- From Jesse Livermore: Good news can be bad news, and vice versa, in the current fiscal and monetary policy environment. The best case analysis of the S&P 500 results in a target price of 3900. Moreover, US equities, and growth equities in particular, are overvalued compared to US value and the rest of the world.

Cam
Thanks for this data rich missive that makes multiple arguments that show expensive US equity markets and relatively cheaper overseas markets.
Here is the question;
In the Jesse Livermoore model, is the 3900 target on S&P 500 based on equivalent yield on cash (or bonds)? So, if a portfolio were to invest and rebalance with only the idea that “equities remain attractive relative to cash regardless of valuation”, the 3900 valuation represents the upper limit where equities remain attractive relative to cash (Earning yield 1/26 = 3.8%)?
Of course, my question assumes that the current interest rate regime does not change. If the current interest rate regime becomes even more relaxed with US interest rates below zero, deeper into the yield curve (to say ten year maturity), wouldn’t US equities support even higher PE ratios than 26?
If rates were to fall further, equities would of course appear more attractive on a relative basis with a couple of caveats:
1) The Goldman Sachs analysis showed that forward P/E ratios get fairly insensitive to inflation (and therefore rates) when inflation is low.
2) Low and negative rates haven’t helped Japan and the eurozone.
Low and negative rates are reflective of a slow growth environment, where earnings growth expectations fall. Keep that fact in mind.
Hi Cam,
Thanks for another excellent market analysis.
Along with the Livermore paper, I’d also recommend the podcast he recorded with OSAM CEO, Patrick O’Shaughnessy this week.
A series well worth keeping an eye on generally..
http://investorfieldguide.com/jesse-livermore-upside-down-markets-understanding-fiscal-and-monetary-policy-invest-like-the-best-ep-194/
Thanks for this and giving me some new reading material. The conclusion in all of these is that monetary stimulus and supportive fiscal policy turn bad news into good news for stocks.
My factor and momentum research is show a change in stock market dynamics over the last month or so that is picking up speed. Markets seem to be adjusting to a Biden/Dem sweep.
Fed Chair Powell talked this week of monetary policy needing fiscal support. He is encouraging more government spending now and in future.
Let’s do a thought experiment around that. Let’s imagine if we had Dems in control of all three branches today and think of how various sectors of financial markets would react.
We would have full support for states hit by lower taxes and higher expenses whether they were blue or red. They wouldn’t have to worry about massive layoffs of government employees.
We would have full funding of schools to reopen safely with smaller class sizes.
We would have actual infrastructure spending rather than just political talk about it.
There would be less business and stock market support and more people support. That includes reinstalling support payments to unemployed workers now that we are in a second surge of Covid. This is what they just did in Canada to help bridge lower wage people to adjust to a post-Covid world.
The global business environment would be more predictable and hence lead to more business investment. Trump chaos in global trade has been so harmful.
There would be a boom in environment infrastructure.
There would be stricter oversight of large tech and social media companies.
There would be a racial truce rather than a race war as non-white communities evaluate changes in government policies.
There would be a hell of a lot of government borrowing with higher long term interest rates and inflation.
The pandemic would come under control sooner.
Healthcare would move closer to universal.
What are the new dynamics I am seeing with my momentum and factor research in investment markets?
First, the long US treasury bond price is down dramatically. Makes sense with the deficits we see in future with a Dem sweep.
Bank stocks are surging as the yield curve rises. Plus better support of consumers would mean fewer loan loses and a resumption of borrowing sooner.
My FAANG + Gorilla index is stumbling as economically sensitive sectors are showing much more strength and investors are concerned about Dem oversight.
Small cap Indexes are leading the market over the last two months and the Low Volatility Index is lagging the other two as well (Growth and Value). This is normal bull market behavior at the beginning of a bull market, not the end.
The general US stock market is outperforming globally again.
Pharma Index last week surged dramatically after being weak for months. Something new is afoot.
The markets will embrace a Dem sweep as they realize we will have a business and social friendly government with massive liquidity from a friendly Fed far into the future. Confidence will be higher as predictability will reign rather than the chaos of Trump’s quick, uninformed decisions.
In other words, we are in for one hell of a good stock market with a need to be selective on the winners and non-so-winners.
OMG! You sound like a liberal – and in Alberta???
Lol!
Easy to be a Liberal until you run out of other people’s money or your credit card hits the limit.
The market is allowing us to borrow at negative real rates. Not sure how long that lasts though
Agreed
Excellent arguments. Million $ question is how do you plan to pay for this?
Exactly. The party ends then.
My understanding of Marxist socialism is that the parties just getting started when the conventional means of collecting taxes peter out. There’s all those rich people and their assets, you know. Once all that wealth is out of the hands of the bourgeoisie, there will be substantial assets to leverage the dynamic economic socialist engine of stealing from Peter to pay Paul, and bingo, the utopia begins, …or you raid the zoo to fill your freezer.
I am entirely amenable to the socialist trade off, where you end up with much less valuable toys, but way more free time, and a reassuring safety net. The problem is that I have read about countries in (northern) Europe being on the brink of financial destruction from the excesses of socialism and at that point, they pivot on a dime, like a well oiled machine, turning 180deg from full speed Marxism to full speed capitalism. I believe that our representatives in WDC do not have the ability to pivot like that, and this will result in the road to a German economy shifting to a road to a French economy, then a Greek economy, and if it all happens fast enough, eventually shifting to the road to Venezuela. So when you go to the ballet polls just think of it as a choice between aardvark and ny-strip or howler monkey and ribeye, and keep in mind that the zoos will run out of stock fast. Good luck.
Thanks Ken for you insight. I could not agree with you more. The last two weeks has seen the market broaden as reflected by the advances over the decliners on the NYSE. The small cap and mid cap are powering ahead. This type of momentum is normally seen at the start of tremendous rally. When the facts change I change. My early posting of September 2 being the high for this move seems incorrect. You have to sail with the wind behind your back. It is lot easier.
Did the S&P 500 get a ZBT buy signal last week? Chart looks more like it back tested support and it held.
Another breadth thrust signal today: >90% stocks >10-day moving averages.
https://twitter.com/edclissold/status/1314591382477180930
85% upside day today, so back-to-back 80’s now go into the book. First display of strength via this metric since the two 90% upside days Friday, June 5 and Monday, June 8. (But just to show how nothing is guaranteed, the market then proceeded to plunge 6% on June 11.)
https://twitter.com/WalterDeemer/status/1314303335533551619
Yes – I have vivid memories of the hit I took on June 11!
Re theoretical explanations of the valuation puzzle – I may be overly skeptical, but is it really possible to ‘explain’ crowd behavior using logic? I’ll bet a hundred behavioral finance professors could come up with a hundred distinctly different theories for price behavior in 2020 – and all of them would sound intelligent, coherent, and even imaginative.
In the end, we all trade price movements – and we each bring a unique skillset to ‘understanding’ the game.
We have breadth thrusts signals everywhere. More on that tomorrow
Our Canadian friends are evincing levels of insight into US politics that shouldn’t even be possible!
If you’d like to vote, I have some extra mail-in ballots.
My 20 year old daughter was born in Boston. She voted by mail in last week.
What’s INEXPENSIVE right now?
1. Puts
2. Volatility
3. Energy stocks
I’m actually considering buying ll three next week. That’s about as contrarian as it gets right now.
Poland
South Africa
Turkey
…if you dare.
Looking at the historical price performance of EZA, I would say it’s a good bet it has a stellar year in 2021. But as you point out – I don’t know if I have the guts.
https://in.finance.yahoo.com/quote/EZA/performance?p=EZA
Strictly on a short term basis, SP500 closed convincingly above 61.8 Fib retracement of September high and low. Odds favor a grind to September highs. IMO. Barring political drama.
That may happen…but why (on a long-term basis) would you buy SPY here?
What happened to SPY 220? There’s no one left who believes it! Yet that was the default expectation last spring.
Now the default expectation seems to be SPX 3900-4000.
For my trades, which are no more than a week to two weeks, Market setup is favorable on the long side. Rut is strong, Spy above 61.8, QQQ almost at 61.8, and dollar weaker. For me, odds favor an upward grind.
Long term, I think it will be much better next year than 2020. Short term volatility notwithstanding.
Re Robinhood investors-
I remember when Boomers changed the game in the stock market. Well, maybe it’s coming to an end. It’s no longer about us. I’m old enough to at least BEGIN thinking the Millenials are coming into their own. Maybe it’s time for me to suck it up and concede there’s a new kid in town who’s about to take over.
IMO, Cam was early. The market can (and usually will) remain irrational longer than we think. In the end, valuations will reflect reality. I think it’s a good bet that stock prices are about to validate many of his analytical conclusions. What has thrown us all off is the behavioral component of price movements.
It may be time to reverse the narratives we embraced last spring.
What if:
(a) A second stimulus package fails to materialize?
(b) A second wave (worse than the first) takes hold, and
(c) A safe and effective vaccine cannot be found?
(d) Double-digit unemployment rates persist into 2022?
My sense of things at this point is – if you want to make a killing, it probably won’t be on the long side.
I have learned a long time ago what I think will happen does not necessary happen. The best we can do is become like the horse whisper – learn to listen. The momentum and volume will tell us which we way the market will go. After many monetary bruises I have given up trying to catch the bottom or the top. The middle is where the big money is made.
Dow 50,000.
‘Upside down markets’.
An amazing wall of worry to climb. Adaptive behavior, innate optimism of humans, scientific innovation, modern Democratic and financial institutions and risk taking will help us get through to the other side. Not everyone will fair equally well, as a nation we will. Be prepared for periods of turmoil, but stay hopeful and optimistic. My view, FWIW.
Fair —> fare
Cam,
How does the outlook you describe above align with your Trend model recently turning bearish ?
In other words, Cam continue to be stubbornly negative and will never get long except some scalp longs for 1-2%
DIX on Friday 39.7. It Is not bullish. Seasonality bad. Earnings? COVID in Europe – frightening increase….
‘ writer under the pseudonym Jesse Livermore’
Am I the only one who thinks most of JL’s text was written by an AI such as GPT3? That is why you see the use of pseudonym and not some analyst taking the credit.
Cam, a question about the 2017 to 2020 graph (the last of those bar graphs).
If empty positive boxes, with no color inside are bad; wouldn’t the Euro growth, with its negative growth and income but positive total return be extra bad and potentially be even more vulnerable to drawdown?
Yes, you have the correct interpretation of the chart.