Mid-week market update: Is time to sound the all-clear? The market staged a relief rally after last week’s weakness. Is the stock market ready to resume its uptrend?
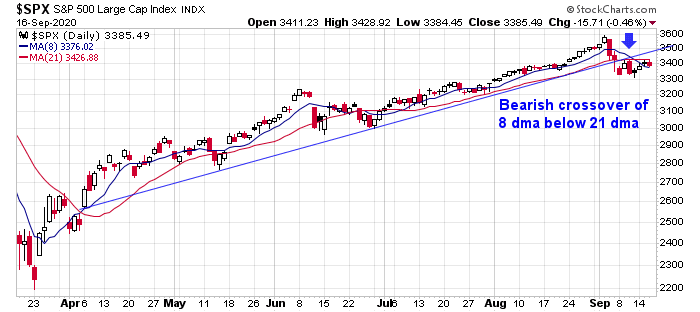
A rally to new highs from these levels is unlikely. Last week’s pullback inflicted significant technical damage that, at a minimum, a period of sideways consolidation and base building will be necessary before the bulls can take control of the tape again. The S&P 500 violated a rising trend line that stretched back to April. As well, the 8 day moving average (dma) fell through the 21 dma, which is a bearish crossover. Repairing the damage will take time.
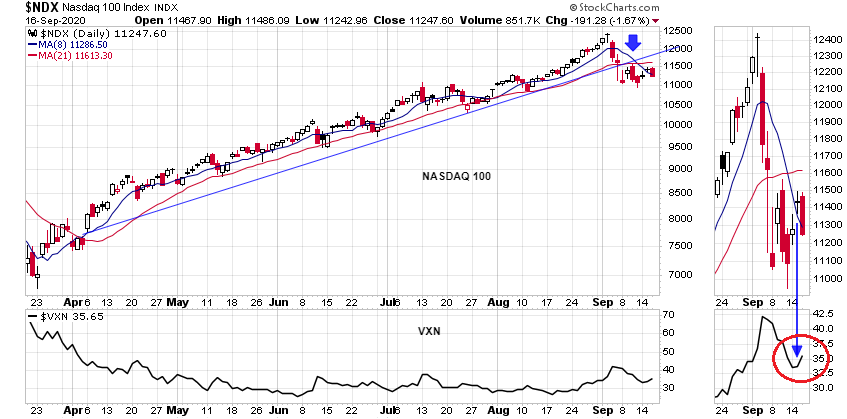
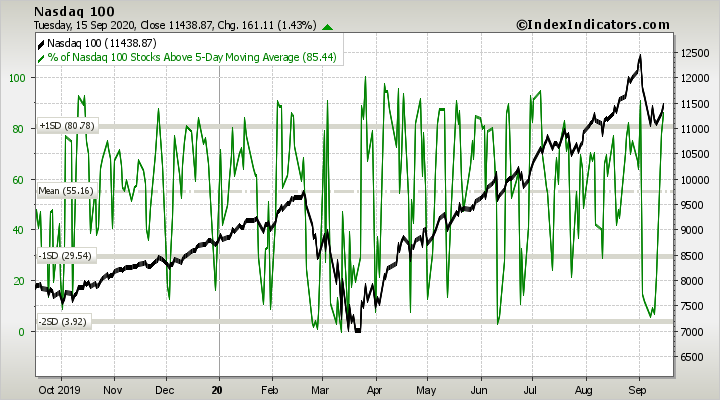
A similar pattern can also be seen in the NASDAQ 100. The NDX exhibited a similar breach of a rising trend line and a bearish crossover of the 8 dma and 21 dma. In addition, NASDAQ 100 implied volatility, as measured by VXN, rose coincidentally with NDX. This is another indication of a nervous and jittery market, which is not a good sign for stocks that had been the market leadership.
Sentiment is still frothy
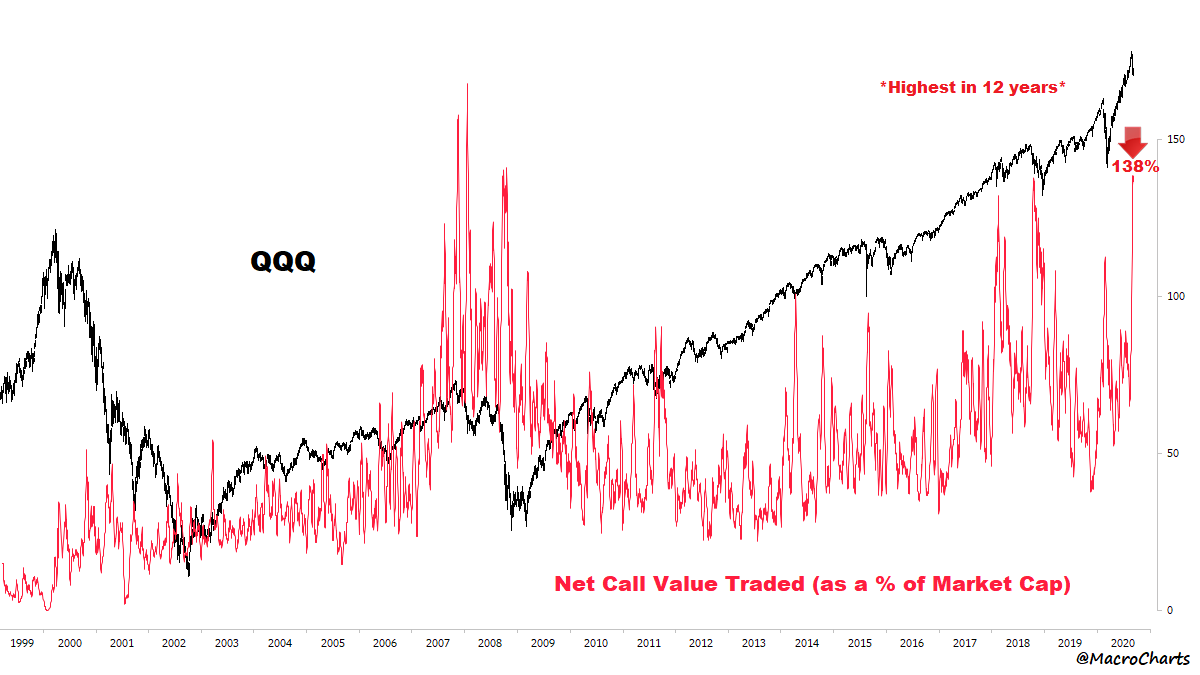
Sentiment models are still showing signs of frothiness. Macro Charts pointed out that QQQ call options are still being bought aggressively in the face of last week’s sell-off. The bulls haven’t capitulated yet.
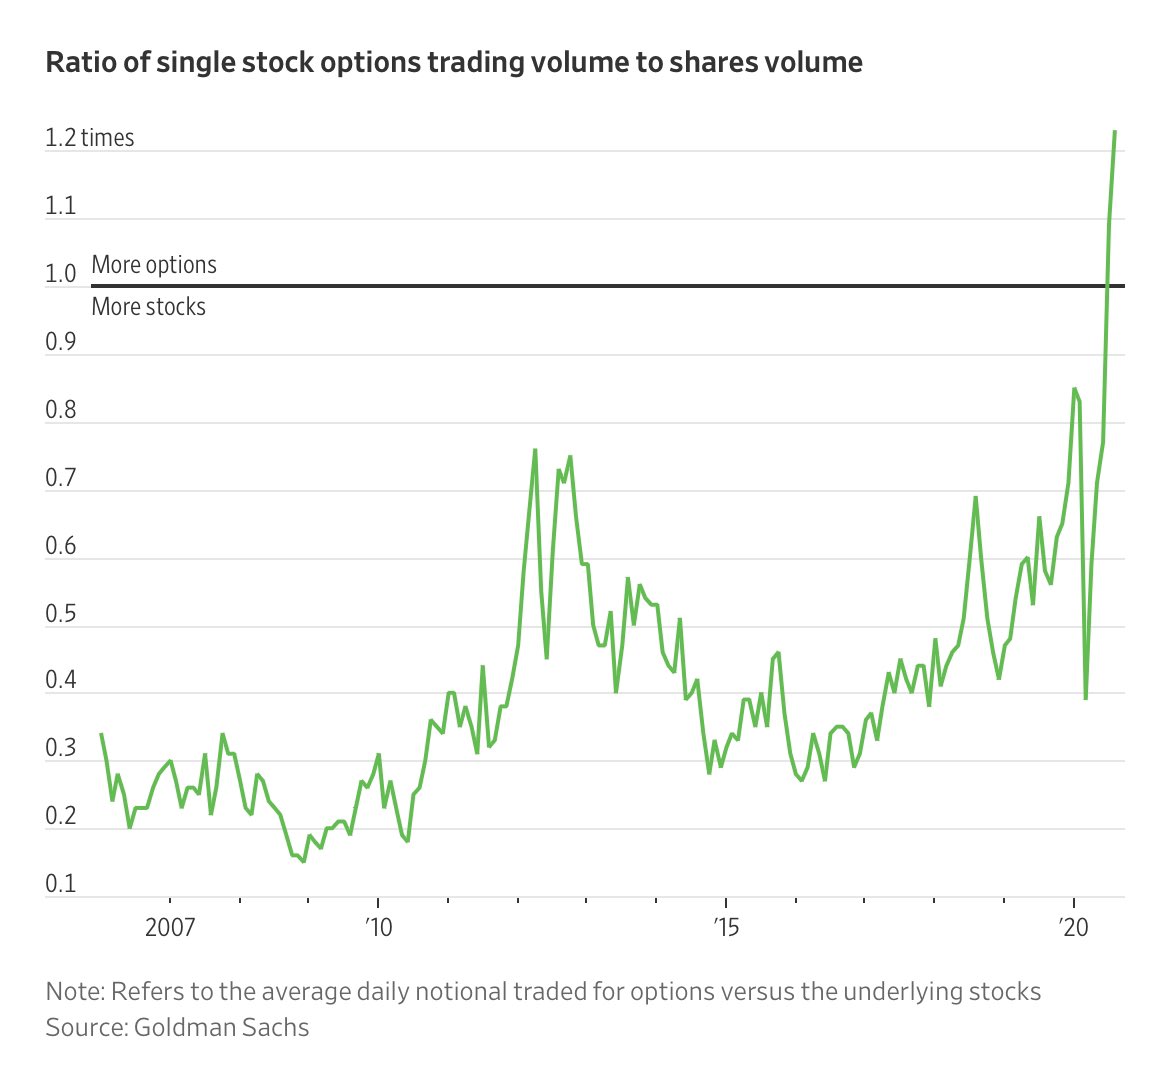
Moreover, single stock option volume is now 120% of share volume. Market wash-outs don’t look like this.
More headwinds
Today’s market action was distorted by the FOMC announcement, and it’s always difficult to get a decent read on the market on FOMC meeting days. Nevertheless, one possible sign of market direction is the inability of equities to hold their gains even after a dovish FOMC statement.
In the short run, the NASDAQ 100, which were the market leaders, came into Wednesday overbought in the short-term. While overbought market can become more overbought, the odds favor either some form of pullback or consolidation at these levels.
Disclosure: Long SPXU
Cam, if this is just a correction in a bull market I don’t know that you can look for a capitulation to mark the bottom. Can we definitely rule this out as a correction rather than a bear market move that should require a capitulation to mark it’s end?
I’ve wondered a bit about conviction and time frame. How, you (Cam) might never be able to say when/how exactly valuations will revert to lows but have high conviction they will. Thus, be willing to suffer some losses short until that happens in weeks, months… hopefully not years. Seems what you’re doing. Consistency should pay off in time.
That’ll why I have the inner trader and investor personas. Each has a different time horizon.
At the very least shouldn’t we have some sort or sentiment reset? It seems that there is still a lot of bullishness among traders right now
I don’t know, Cam. The chart you show with the 8/21 cross still looks pretty bullish to me. Especially if you expand it and put 50 and 200 dmas on it.
Granted, the end of today’s action was not positive but I think we need more than that to call for new lows in this move now that we have consolidated somewhat.
Isn’t there a difference in bullish views expressed using call options (defined risk) vis-à-vis buying stock? I have used call options recently to a. Lock in gains by selling stock but continue to participate in potential upside with call options, and b. To speculate in upside with limited risk.
We do not know how these call Options are being deployed. In case of a. above, it’s a defensive posture!!
Yes there is, but it depends on how you trade the option position.
A lot of beginners look at the leverage potential in options and see dollar signs in their eyes. That’s why they’re very speculative.
To be sure, it was not an easy trading day today. Volatility crept up from nowhere (doesn’t it always, LOL). I got out of positions barely, by the hair of my chinny chin chin. Such erratic one day volatility is generally not what market bottoms are made of IMHO. Today was only the first day of such volatility. Even after the market opened at six pm, volatility rules, as I write this.
Snowflake IPO, dovish Fed statement and Apple new products (especially streaming services), did not propel the market higher!). Doubling of Snowflake reminds me of 1999! What can I say. One day gain of 35 billion $ seems absurd to me. That said, Mr. Buffett made a billion $ today! Didn’t realize Mr. Buffett player the casino like this.
Even Frog was up 47% today (only 6 Billion market cap FWIW).
If Palantir doubles on IPO next week, it would be even more scary.
As I write this, we had a short bounce in S&P futures and a sell off. Stay safe friends.
Some support at 3350, but we are looking at 3300. We are seeing a further sell off.
Right now at 3369 (ESU 20, September S&P 500 futures).
We touched 3320.5 last night and bounced off on S&P 500 futures. This is the third time we have bounced off this level in the last 10 days (8th, 13th and 17th June. At the top end, we are trapped below the 3450 level. Each time, we are making a lower low, but a higher high, indicating a triangle or a coil formation.
Near term trading range is more in the 3320-3429 range. That said, such coils can test ones patience and may go on for a while. I suspect, with elections around the corner, the coil breaks down (rather than break above 3450). Next level below is 3020, the October 2019 break out level. This is an important level, as we hit resistance at this level three times prior to the breakout.
As an aside, I still do not understand why VIX September futures are tame, and not cracking higher with such downside volatility.
D.V. I’m sure Warren bought restricted stock and much, much cheaper than the IPO. It pays to be a big time investor.
Cam, good call on the short position.
Hi Cam,
Why is the recent 8/21 dma cross-over bearish but the one June was not ?
I wasn’t paying attention in June
Good observation, Gordon.
Not looking good for longs this morning, but it’s not a disaster.
I’ll need to manage my way out of a nosedive. My first move is to wait – it will take at least an hour to get a bead on where the market may be headed from here.
Looking over my instrument panel-
(a) 25% long (added to positions yesterday and now up from 17% long on Tuesday).
(b) Estimate a -2% pullback on positions today, or about -0.5% overall.
(c) Currently -2.65% year-to-date. If nothing changes, by end of day I’ll be -3.15% ytd. My pain threshold lies ~-5% – so I may have a day or two to manage my positions.
In the meantime, I’m glad to see some of you cashing in on the short side.
My thinking right now – had I been in cash I would have bought the open.
Well, back to the 50 dma this morning. Although it is just a bit higher now.
Rel. S&P. There is also a monthly fib at 3330. The daily lows last week on Tue and Thur were right at this fib. Fri. last week poked through to 3310 then closed above the fib. That started the rally early this week.
The S&P grudgingly went through the first daily fib on the way up and bounced off the second one just under yesterday’s low. Now we are back at the 50 dma. Depending upon which way it goes, there is still the weekly fib at 3410 and if it breaks down it won’t hit another fib until 3260. It could go either way from here.
Relative strength from oil, high beta and semiconductor indexes look improved but not terribly so as the S&P is trying to bounce at the 50 dma. Looks 50/50 on direction to me.
The bounce is very weak – no volume. I think the market is waiting to see if the dems will finally move on the stimulus bill. Moderate dems sent Pelosi a letter last night asking her to do something. If there are no constructive comments today, we probably sink this afternoon.
The bounce over the noon hours couldn’t even make it back to the closes fib. We’ve since slipped back to just above the days lows. Some buying is showing up here, which is a good sign but far from out of the woods yet. Keep an eye on the 50 dma level at 3330. A hard break of that level that doesn’t immediately draw in buyers will mean another leg down.
Buyers showed up with some volume at 3330~. The odds favor a rally to the close now. Not 100% though.
Took a small long position with a stop just under the daily lows. Looking like it may have been a bull trap. We’ll see what happens by the close.
Covered at the first fib for a decent gain as it was providing some resistance. Probably will prove to be too early.
Could have squeezed a little more profit out of that trade but the near fib provided more resistance than I was expecting. We did eventually power over it before the close. Overall, a profitable trade and a much better looking close than yesterday’s.
From SentimenTrader-
Fund managers like tech stocks…a lot
A new bull market has begun.
At least, that’s the take from the latest results of the monthly Global Fund Manager Survey conducted by Bank of America. The survey of more than 200 asset managers, with nearly $650 billion under management, reflects views through September 10.
Since a new bull market has begun and technology stocks are leading the charge, it makes sense that the managers are the most overweight that sector.
And yet despite being the most overweight in that sector, the managers also believe it’s the most crowded trade. They’re heavily overweight, more than any other sector or asset…and so is everyone else.
According to Michael Hartnett, Chief Investment Strategist at BofA Securities, if you’re long technology stocks in the U.S. then you’re a part of the most “crowded trade” of all-time.
We go back to 2013 and look at the most crowded trade for every month, then look at that asset’s (or sector’s) returns over the next 1, 3, 6, and 12 months. While fund managers might have their pulse on what’s crowded, that hasn’t necessarily translated to future returns.
So it appears I’m currently part of the most crowded trade of all time.
LOL. Aren’t we all? Well, except for Cam, of course.
The psychology of taking losses.
First and foremost is to TAKE THE LOSS(ES) quickly. Not necessarily immediately – generally when i find myself hoping a position bounces back (as opposed to being pretty sure it will) that’s when I need to close. If the position then reverses, no worries – avoiding the times it fails to reverse and continues to move against me more than makes up for it.
All positions off at the close.
Dodged a bullet. -0.79% on positions closed for about a -0.2% hit to the portfolio.
This may come as a shock to most of you. I’ve learned today that the Biden campaign has no ground game in any state! None! I predict that by October 15th Joe will say he is too tired and will just stop campaigning at all except for a few of his basement appearances. I know, it’s shocking. That’s what I see happening.
https://www.sentimentrader.com/blog/options-speculators-pull-back-but-are-still-jaw-droppingly-aggressive/?utm_source=Daily+Report+Lite&utm_campaign=67a1332a4e-Options_speculators_pull_back_but_are_still_jaw-dr&utm_medium=email&utm_term=0_1c93760246-67a1332a4e-1270438493
The graphics here are mind boggling. No wonder the market is up as high it is. Individual option traders seem to be still bullish. Not a good set up for long positioning for new money.
https://www.bbc.com/news/uk-politics-32810887
To be sure, the rules are still foggy and there will be some last minute haggling. This may be the trigger that pulls back equities to the 200 DMA 30xy.
For long term portfolios, EWU may be worth considering (yield 3.7%; ten year returns are the same).
From SentimenTrader-
Smart money buyers have stepped away
One of the supporting legs of the rally beginning in the spring and lasting through June had been buying pressure from corporate insiders and other “smart money” investors. That began to moderate in August, especially among technology shares.
Lately, buying interest has dropped off significantly among members of the S&P 500. While there are still a large number of buyers over the past 6 months thanks to heavy interest in the spring, it’s dropping quickly.
The 4-week rate of change in the Corporate Insider Buy/Sell Ratio, which we call Velocity, has dropped below -20% for stocks in the S&P 500. According to the Backtest Engine, future returns have been poor whenever broad-market insider Velocity was below 20%.
The deeply negative Velocity is a concern, but it’s minor. The reason is that the overall level of the Buy/Sell Ratio is still very high and it tends to be a longer-term metric.
The S&P looks like a bearish flag is being formed. Today being triple witching, we should see some volatility. Keep an eye on the fibs a 3330 and 3410 for breakouts or reversals.
The S&P bounced off a daily fib at 3336 which is also the 50 dma today. Buy volume was light and it looks like the bounce will fail. Weak Semis, Fangs and High Beta looking lower. Still could bounce if those firm up quickly.
Tricky pattern to play here. I don’t think we’ll see a breakout either way today – I’m looking ahead to next week.
Agree with 3330/ 3410. Best setup for a ‘long only’ guy like me would be a break below 3330->quick decline + reversal back above 3330 for a buyable fakeout to the downside.
I don’t think this is a good place to play today. Support/resistance are too close together in here to make any money. Plus the leading indexes/volume etc. are not giving good clues at the moment.
Broke down. Next support at 3328-3330.
Leading indexes were pointing to a severe break but the S&P just got some buyers pushing it back up. That’s why it’s not safe to trade right in here.
Everything ST is looking bullish right now. But with OpEx today it can turn on a dime. Plus this is not a good spot to pick a side, we still have the bearish flag and the time of day makes trades tricky. Maybe I will see something setup in the last hour or so of the day. Or I may just not bother today unless we break toward 3300 in which case I may try to put on a hedge for my long positions.
Quad witching today. If you have such a short time horizon the prudent course of action is to step aside
Back to new daily lows as everything deteriorated again. This might be a buy but it looks too ugly to me. I’m more concerned that I may need to put on a short hedge if we break down and I get an opportunity.
Looking for 3310 then a little bounce then lower to the next fib at 3260.
Put on a small short position on this rally. May add to it near the close and hold over the weekend.
Added to short and holding til Monday.
Missed getting a short on by a fraction of a cent. No bounce at 3310. Looking like no-mans-land now.
I think if we break below 3300, it will be a quick trip to 3200. On the way up it only took six days to move from 3200 to 3300.
Congratulations to those who have taken the bearish trades this past week or two. Prior to these last two days, it was not possible to tell on a weekly basis the deterioration in SPX advances while the NAS summation had been falling since 7/24. Today, on this Friday’s close, this would be only the second week that the weekly sum of the summation indices of SPX and NAS has declined, the last time being the close of the week of 6/26/20. It is possible that the price action and market internals that we saw today could all be ascribed as a triple witching effect and the market could advance again as it did on 6/29, but it has become more likely that instead of a September, October rally that we had in 2019, we could see something closer to the 2018 deterioration that saw a quick decline into October, 2018 and perhaps further. Closing long swing trades and initiating a short position into the close as it does not look like the market internals will recover the week’s losses even as SPX has not broken price support at 3285.
https://postimg.cc/FYXfNDG5
Hulbert’s Sentiment Index dropped further to 8% today.
Hoping for a snapback rally sometime next week. For some reason, I see a target of SPX 3240 via multiple sources. So any decline is likely to either stop well above or well below 3240.