Mid-week market update: For the last two days, the SPX tested the 3000 level and its 200 day moving average levels and finally broke up today. However, market breadth presents a mixed picture. Fresh 52-week highs have been understandably strong for NASDAQ stocks, as they have been the recent leadership. However, new highs for both large and small caps are less than impressive, which calls into question the sustainability of this rally.
Who wins the knife fight at the 3000 and 200 dma? Here are bull and bear cases.
The bull case: The rally broadens
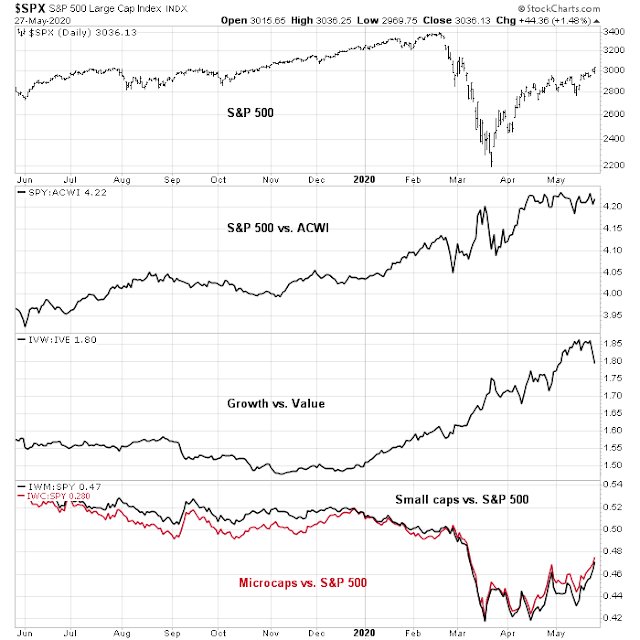
The main bull case rests on the constructive nature of the changing market leadership. The old price momentum leaders of US over global, growth over value, and large caps over small caps have faltered. In the place, leadership is broadening out to previous laggards such a small cap, cyclical, and value stocks.
Cyclical stocks are turning up on a relative basis.
The relationship between the reopening stocks and stay-at-home stocks is stabilizing, and may be turning up, indicating a renewal of risk appetite.
The breadth of the market strength is indeed impressive. Eurozone stocks are attempting an upside breakout, though the leadership is narrow and only limited to Germany.
The UK is also testing a key resistance level.
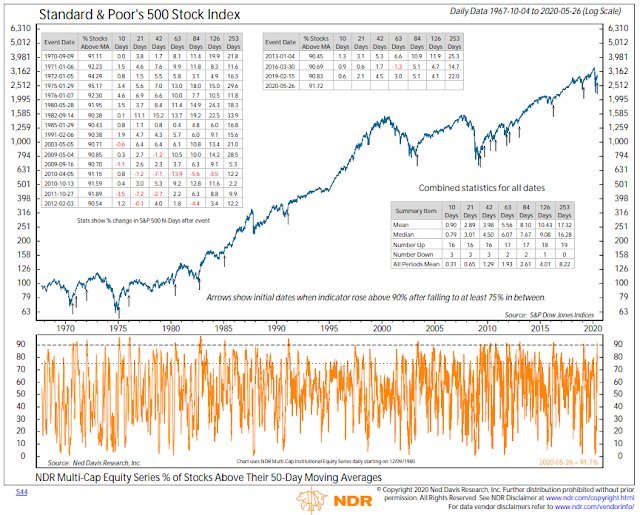
Ed Clissold, chief strategist at Ned Davis Research, makes the case that the broadening breadth is supportive of a sustained advance. 90% of stocks are now above their 50 dma, which is a bullish development.
The bear case: What cyclical turnaround?
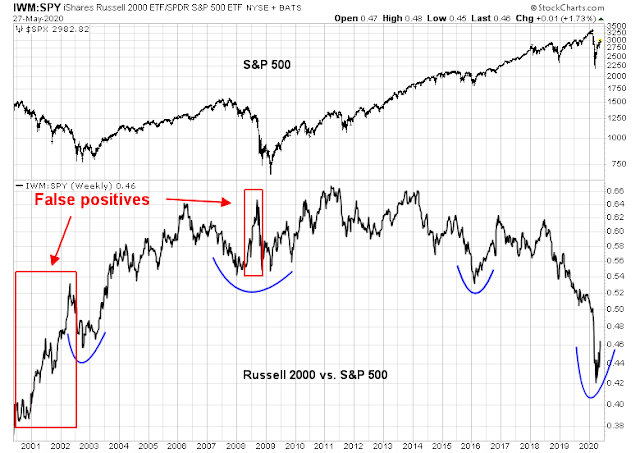
The bear case begins with long-term concerns. Some technicians have pointed to the nascent small cap as a possible sign of an economic revival, which has signaled cyclical recoveries and major market bottoms. While I am sympathetic to that view, this indicator has shown hit-and-miss results and produced false positive signals in the past.
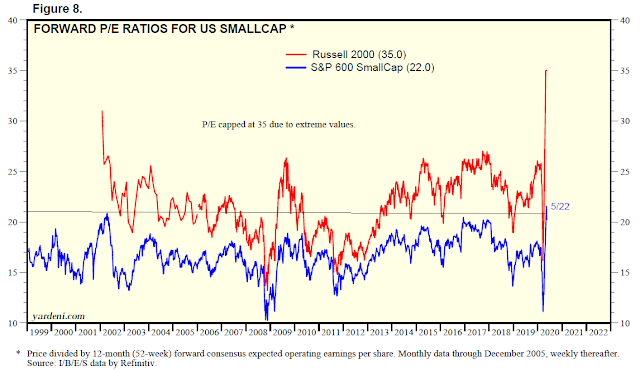
I know that traders aren’t supposed to care about valuation, but the small cap leadership is a sign of a cyclical recovery thesis is undermined by the highly stretched valuation of small stocks. The forward P/E ratio of the small cap Russell 2000 is literally at an off-the-charts high because of a low E in the P/E ratio. Instead, we can analyze the forward P/E ratio of the S&P 600 small cap index, which has a more stringent profitability index inclusion criteria. The S&P 600 also trades at a historical high at 22.0 times forward earnings.
Speaking of valuation, value stocks are not exactly cheap from a historical perspective either. While investors can expect some valuation refuge in value names, downside risk is still considerable should the market mood turn negative.
Despite the recent rally, the bulls still have much work to do from a long-term technical perspective. The monthly MACD indicator is a long way from flashing a buy signal, and such buy signals have been extremely effective at calling fresh bull markets in the past.
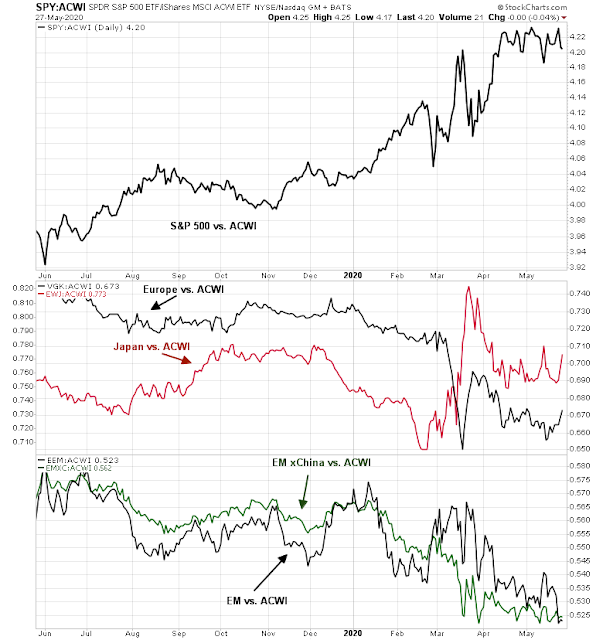
The idea of broadening leadership is an attractive idea from a conceptual perspective, there is no sign of new leadership from a global perspective. US stocks have stalled relative to the MSCI All-Country World Index (ACWI), but the same could be said of Europe, Japan, and emerging markets. All regions have been moving sideways on a relative basis for the past 4-8 weeks.
The fickle narrative
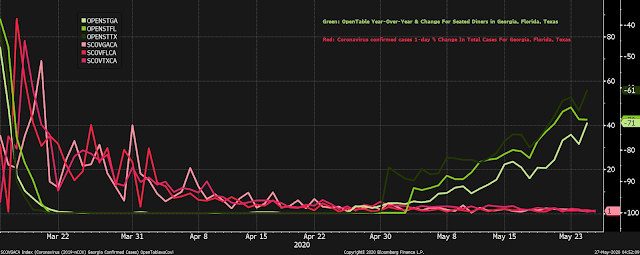
So where does that leave us? It might just up the market’s animal spirits to decide on the market narrative of the day. Joe Wiesenthal at Bloomberg is watching how some of the more aggressive US states are reopening their economy, and the change in COVID-19 cases as a way of monitoring the market’s mood.
The green lines show OpenTable seating data for restaurants in Georgia, Florida, and Texas (three of the earliest and most aggressive states in terms of reopening). The red lines show the daily percentage change in total coronavirus cases in each of those states. The key thing is that all the lines keep going in the right direction. If the return to normal starts setting off a new wave of cases, that will be a red flag. Or if dining activity stalls out at a very depressed level, that would be ominous as well. And it’s certainly possible that service sector activity could just hit a ceiling as a substantial portion of the public changes their behavior. But for now, all the lines are going in the right direction.
As traders have learned in the past couple of months, the market’s mood can be very fickle. While the market’s focus today might be focused on the progress of reopening efforts, it might shift its gaze tomorrow to the deterioration in Sino-American relations tomorrow. Secretary of State Pompeo has declared that Hong Kong is no longer autonomous from China, signaling a possible end to special trade relationship with the territory. As well, Reuters just reported that a Canadian court has ruled against Huawei CFO Meng Wanzhou’s case against extradition.
Meng’s lawyers argued that the case should be thrown out because the alleged offences were not a crime in Canada.
But British Columbia’s Superior Court Associate Chief Justice Heather Holmes disagreed, ruling the legal standard of double criminality had been met.
“Ms. Meng’s approach … would seriously limit Canada’s ability to fulfill its international obligations in the extradition context for fraud and other economic crimes,” Holmes said.
The ruling paves the way for the extradition hearing to proceed to the second phase starting June, examining whether Canadian officials followed the law while arresting Meng.
There is also the prospect of quantitative tightening as the Fed eases its foot off the QE pedal.
In the short run, market breadth was already overbought based on Tuesday night’s close. While the odds favor a pullback, the market has also been known to advance on a series of “good overbought” readings.
I am closely watching the signals from the credit market. The relative price performance of high yield (junk) bonds and municipals are exhibiting minor negative divergences against stock prices. This is especially important in light of the lack of earnings in the Russell 2000, which is indicative of the low credit quality of that index’s constituents. The relative strength of small caps and the relative performance of HY bonds is an important relationship to keep an eye on.
The Trend Asset Allocation Model’s readings have turned from bearish to neutral, and my inner investor is reluctantly and slowly adding equity exposure from an underweight to a neutral position by focusing on buy-write strategies (long stock, short call option) to mitigate downside risk. If I had to guess, the range of my market scenarios for the next six months calls for a 40% chance that the market would revisit its March lows, 40% chance of a wide range-bound market, and a 20% chance that the market would push higher.
My inner trader is confused by this market action. He is standing on the sidelines.







My take is that the market is reacting to the newsflow here, so the bull/bear stance is shifting intraday. The initial fear last evening/night was that the Yuan may weaken further, but that didn’t materialize, so we rallied from ~2985. Today the market turned bullish when Reuters reported that the US administration may react to the new Hongkong law in a relatively meaningless/symbolic way. There seems to be strong consensus by now that the virus is not going to cause economically disruptive lockdown measures again and that life is returning to normal while significant stimulus measures are being enacted around the world. What is holding up the rally here is the uncertainty around US/China relationships. It is difficult and be misleading to parse the diplomatic language, but I think the market is seeing this as a lot of noise without real economically meaningful action (at least until now) China has made references to it’s military strength multiple times most recently, I guess (and hope) that message is well understood in diplomatic circles.
“20% chance that the market would push higher”–> Cam do you mean ATHs?
Not necessarily. Just higher
Thank you!
Had the pleasure speaking with Ken on his factor based research. Very insightful material to read the ‘tape’, which the signal from the market internals can provide meaningful actionable/profitable asset allocation decisions.
Thanks for your time, Ken. Look forward to hearing more from the factor model and test in real time.
Urban Carmel has a thread on breadth. He cautions us with strong breadth. Bad breadth is a sign of washout low. But when the breadth is strong, it implies investors are buying stock with abandon. They are being less selective. It is sign of risk-seeking and a sign of trouble arriving.
https://twitter.com/ukarlewitz/status/1265752272518037504
Had to laugh at Hertz, HTZ an overnight double (to $1.20 from .60), and having already filed for Ch 11 bankruptcy. No chance the equity has any value.
I’ll say they are less selective!
https://www.topdowncharts.com/post/2020/05/12/broken-indicators-the-forward-pe-and-the-peg
From JPMorgan:
U.S. equity markets are on track for a V-shaped recovery, according to JPMorgan.
Positive reopening trends in China and Europe are giving the Wall Street firm hope the U.S. will follow suit, and experience steady virus normalization and a sharp, rapid economic recovery.
“A steady and uninterrupted lockdown relaxation process points to a Vshaped recovery in Western economies, favoring traditional cyclical and value stocks for the next few months,” JPMorgan Global Quantitative & Derivatives Strategy Analyst Nikolaos Panigirtzoglou told clients on Wednesday.
It’s starting to feel like there is a decent chance we see all time highs this summer as sentiment gets ahead of itself. And then this fall, with the inevitable return of the virus comes, the drop will be just as swift again as the herd realizes this is a longer term thing than they thought.
We are up 39% in about 2 months from the lows of 3/23 and only 10% away from previous high on 2/19. The momentum play, backed by actions on the ground, is to stay long, IMO. More recently people are getting on the bandwagon. Cam is also moving to his policy stance.
Bob Farrell once said, The markets make the news. The news does not make the market.
The most volatile markets are bear markets. Witnessing huge swings is a sure way of knowing you are in a bear market. Most of those swings are random shifts of hot money. The media and we ourselves try to link meaning to this.
I do know that investors have shifted from panic thinking at the March lows to ‘things will be fine’ thinking 30% higher.
It seems improbable to me that we had a one month bear market, shut down the world economy and now everything is all sweetness and light. If or when the market falls, we will find reasons why it was so predictable afterwords. If the markets march on to all-time highs, it will be hard to find a story to fit the event.
Ken thanks for sharing your Factor information with me this AM. After 40 years in this industry there are always new tools and observations to be found! If Ken is still willing to share this information, everyone here should take advantage of the opportunity.
Cam, I hope you will all forgive my confusion – having watched the markets recover nearly all their index losses over the last 2 months, and having had a couple of abortive short losses, you now think it is a good time to start going long?
Where are we in recession terms (dates approximate)?
Are we even in a recession or is this just a correction?
Just started (May 2008 equivalent)?
In the middle but it will get yet worse (August 2008 equivalent)?
At the bottom and it just gets better from here (May 2009 equivalent)?
I understand your confusion.
When you have over 20 million unemployed, and an unemployment level that is only exceeded by the Great Depression, there is little question the economy is in a recession. The recession began in Q1 when the economy came to a sudden stop.
No, we have no idea of when it is coming out. As Powell aptly put it, it all depends on what happens with how the fight against the virus progresses.
As for the stock market, the bull case is investors are looking over the valley. The bear case is investors are deluded, you don’t know how far the valley stretches. I also pointed out that if Fed liquidity solved everything, Japanese and European stocks would have been the clear leaders over the past decade.
Cam – going forward can you update your inner trader position on the website (and not just in email) whenever you close a position so we can see this. Currently it is still showing you as short.
The market is rallying because people realize, as i stated in a long winded comment a few weeks back, that covid poses no threat to anyone other than 70+ with comorbidities. As such things will get back to normal and a second wave in the fall would likely be dealt with by focusing on locking down nursing homes and not much else.
So, JD, your take is that the “recession” is over and the V shaped recovery is what is happening?
Hi Joyce – i don’t know if the recession is over. But markets bottom far in advance of the economy so i wouldn’t be surprised if 23 March was the low. V shaped might or might not happen. But the renewed discussion of “V” possibility is at least driving positive sentiment.
So the 100K deaths, which is nearly twice the level of American deaths during the entire Vietnam War, and over 30x the deaths of 9/11, is just a blip and ignorable?
On a cumulative basis, about 40 million Americans have filed for jobless claims, which comes to about 25% of the workforce, has minimal economic effect? Similarly, the oncoming tsunami of small business failures has little effect on the economy?
I have some Hertz and Gold’s Gym that you can have for a good price.
Hi Cam – 480k american’s die from smoking each year, 472k from hypertension related, 300K from obesity, etc, etc, etc. Vietnam deaths were 23 year olds, covid average death is 78.2 years (same as the US life expectancy for males). While obviously still tragic, STATISTICALLY, in a country of 330M people, 100K deaths in sick elderly people is a blip.
Regarding economy. The damage is massive and can’t be ignored. We are in for some hurt. Market is ridiculously overvalued and becoming more so each day. As you state, when the focus shifts from reopening euphoria to earnings disaster the market will certainly head down. However, no one knows when that will be. As such i’ll stay at approx 40% cash and buy more at that time.
You can keep Hertz and Gold’s ( i don’t buy stocks in individual companies).
I would just like to point out:
78.2 years is life expectancy at birth.
The average 80 year old can expect to live 8-10 more years, depending on whether male or female.
https://www.ssa.gov/oact/STATS/table4c6.html
This despite the fact that many 80 year olds have ‘comorbidities’. Having a physical or mental health affecting condition (‘comorbidity’) does not imply you were already at deaths door.
Think the market’s argument is ; most employees unemployment is temporary , several investment firms estimate 50%-70% of unemployed are actually earning more in unemployment than when employed. Not saying I buy that but it’s the current argument of bulls.
But you said you are going to start normalizing your investment portfolio on dips, Cam. I assume you mean dips such as we’ve had so far on the way up. I’ve been so far on the side of cash since late February the prudent thing seems to be to start bringing that ratio up to about 40% invested by adding on minor dips in this environment.
Regardless of age, people with hypertension, obesity, asthma/respiratory issues, immunocompromised, and diabetes were prone to severe symptoms from COVID-19.
Your statement is wrong.
Cam…with all due respect, the $100k deaths is only a tick more than the flu took a couple of years ago. My grandmother passing from Covid (3 weeks ago today), while sad and heartbreaking, doesn’t impact much of the economy or justify a 30% stock market plunge. However, your point about the 40 million jobless claims and likely small business failures is what is relevant to the stock market moving forward imho.
One sector that may be on its way back is miners. NEM looks good here ~59.2x.
I already grabbed 10% on ALB
Nice. That’s a new ticker symbol for me, but seems to be a solid company.
It’s a bet on the secular trend of renewable energy; lithium will power transportation, grid storage, home backup, etc.
It was a pleasure speaking to Ken today. He was very informative and has a good system, bits and pieces of which he has been sharing with us over the past few years.
Thanks for all your information Ken. Keep up the good work.
Ken, thanks again for a very informative and thorough look at your system, which can be really helpful along with Cam’s great work here when making investment or trading decisions.
SPX may finally be stalling out.
SPY 295/ 285/ 275 are approximate targets I have in mind for ST/ MT/ LT plays.
The market has done it’s job.
Against all odds, it has everyone (including me) convinced that a retest is now off the table -whereas just a few weeks ago SPX 2750might have been the highest retrace target anyone had in mind.
Six weeks from now 3000 may have faded into distant memory with downside targets changed to ~2100. Recency bias prevents me from giving it serious thought right now – but hey, 2-3 weeks of downside action is all it would to change my mind.
There is a clear ‘divergence’ in the odds layed out at the end of this post( Only 20% upside) and the actions to increase equity exposure from defensive to neutral. I would think that these odds now call for getting defensive slowly on rallies than to buy the dips. https://tinyurl.com/yce9h79s
Sorry for garbled post. I was saying I am confused why buy the dip instead of selling rallies?
1. Not sure I agree with the stated odds.
2. To each his own when it comes to finding an edge – based on years of experience I’ve come to realize that playing strictly the long side (whether in an uptrend or a downtrend) imparts more conviction in my trades. My only other alternative is cash.
Good video here https://www.youtube.com/watch?v=IvJw5eO_YPQ
Nice. I would love to see a -10% pullback that sets up the next leg higher.
Seems very possible…
Sentiment Trader first called my attention to how quickly things happened on the 2020 decline compared to the 1929 initial decline. In 1929 the low was reached 49 days after the high, this year in 27 trading days.
It is generally conceded that there was a retest of the 1929 low, but a careful examination is more revealing. There was a low on Oct. 29, followed by 2 up days. Then 2 of the next 3 trading days were trading holidays with a down day in between, then a 6 day plunge to the “retest low”. I believe on a no gap chart most observers would not detect a retest in 1929.
Another way of saying the same thing is looking at the 2020 chart (remembering that in 2020 time the 2 day “rally” only takes 1 day) and concluding that 3/16 was a “low” followed by a one day “rally” and a 4 day plunge to the “retest low”.
My take is there was no true retest in either year. The 1929 chart is an illusion caused by the holidays.
Over the next 6 months, starting in Nov, 1929, the actual retest took place, failed, and the rest is history.
Just saying.
Isn’t there a vast difference between 1929 and 2020?
This market is squirrely.
Bad trades?
I don’t know. Sometimes I follow my sixth sense regardless of whether it’s ‘rational.’
I watched the first sixty minutes of the day. A continuation of Thursday’s downside – no surprise.
Then I listened to the White House conference – a spike down as the President began speaking…followed by a spike up as he failed to address the trade issue (ie, an abatement of fear).
I took out my buy list (prepared the night before/early this morning). Then I spent the last twenty minutes of the session opening positions in SPY/ EWH/ XLF/ KRE/ BAC/ JPM/ XLE/ BA/ JETS/ UAL – ie, the SPX + the same banks and tanks I closed earlier in the week.
It may have a been a bad move, in the sense that I can’t ‘explain’ it. But I have to follow my process, which includes not hesitating when I sense it’s time to buy.
I’m wrong half the time. That’s just part of the game.
I “think” I detected a small buying climax in the after hours. The pattern has been to buy late Friday in anticipation of the Sunday night swoosh up.
I faded (shorted) this move AH at a price substantially above the Friday high, but very lightly. We’ll see.
There are an infinite number of ways to make money trading the markets. Good luck!
Friends
I would like to suggest taking a look at Paul Merriman’s book, Financial freedom forever. The tables at the back of the book are very instructive and show what happens with a fixed withdrawal with different levels of exposure to stocks/bonds/cash etc.
The idea is to maintain stock market exposure regardless of conditions, even if you are retired.
For all those reading this, as recommended by our master and guide, Cam, it helps to maintain a “target allocation” at all times.
Christine Benz from Morningstar has noted that any portfolio in a long running “accumulation phase” will experience dips along the way. Dollar cost averaging strategies would make sure one buys these cheaper stocks on dips.
The recent pull back of -30% in a very short time was a historic anomaly. That said, if I told you a similar scary dip will happen again would you believe me (Please do not ask me when)? In such a case:
Would you have the guts to buy at -20%?
Would you have the guts to buy more at -30%?
How about buying more at -50%?
Only you, the reader of my post can answer these questions. That said, most investors will answer no to the above questions (which is precisely the opposite what one should be doing).
Our minds have been programmed for eons to not stick our heads in the lion’s mouth. It’s tough to do.