Preface: Explaining our market timing models
We maintain several market timing models, each with differing time horizons. The “Ultimate Market Timing Model” is a long-term market timing model based on the research outlined in our post, Building the ultimate market timing model. This model tends to generate only a handful of signals each decade.
The Trend Asset Allocation Model is an asset allocation model which applies trend following principles based on the inputs of global stock and commodity price. This model has a shorter time horizon and tends to turn over about 4-6 times a year. In essence, it seeks to answer the question, “Is the trend in the global economy expansion (bullish) or contraction (bearish)?”
My inner trader uses a trading model, which is a blend of price momentum (is the Trend Model becoming more bullish, or bearish?) and overbought/oversold extremes (don’t buy if the trend is overbought, and vice versa). Subscribers receive real-time alerts of model changes, and a hypothetical trading record of the those email alerts are updated weekly here. The hypothetical trading record of the trading model of the real-time alerts that began in March 2016 is shown below.
The latest signals of each model are as follows:
- Ultimate market timing model: Buy equities
- Trend Model signal: Neutral
- Trading model: Bullish
Update schedule: I generally update model readings on my site on weekends and tweet mid-week observations at @humblestudent. Subscribers receive real-time alerts of trading model changes, and a hypothetical trading record of the those email alerts is shown here.
A momentum driven market
As the stock market continues to grind to new all-time highs, there is mounting evidence that this is a strong price momentum driven market, as evidenced by the breach of the upper monthly Bollinger Band. As well, Arthur Hill pointed out that 8 of the 11 equal-weight sector ETFs recorded new highs last week, as did SPY and the equal-weighted equivalent RSP. While such episodes have signaled tops in the past, they have also been a key characteristic of strong uptrends.
How should investors and traders react to such circumstances?
Reasons to be cautious
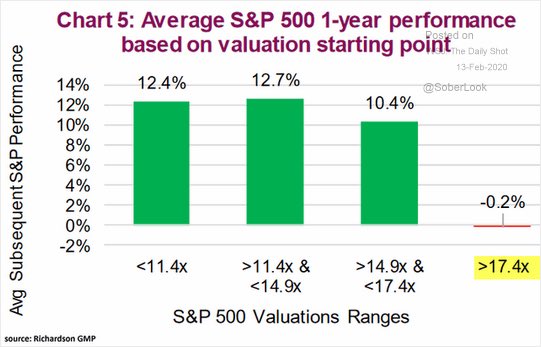
There are plenty of reasons to be cautious. The market is trading at a forward P/E ratio of 18.9, which is a 10-year high.
If history is any guide, the market has not performed well in the last 85 years when the P/E ratio has been this elevated.
To be sure, Q4 earnings season has been reasonably constructive. While the EPS beat rate is only slightly below the 5-year average, the sales beat rate is well above historical norms. More importantly, forward EPS is rising, indicating positive fundamental momentum.
While the Q1 negative guidance rate is slightly better than average, FactSet reported that a substantial number of companies discussed the impact of the coronavirus outbreak but declined to modify their guidance because they could not gauge its impact. In an ideal world, the market would demand a premium for this uncertainty, but it has not.
While many of these 138 companies discussed the current negative impact or the potential future negative impact of the coronavirus on their businesses, 47 companies (34%) stated during their earnings call that it was too early (or difficult) to quantify the financial impact or were not including any impact from the coronavirus in their guidance. On the other hand, 34 companies (25%) included some impact from the coronavirus in their guidance or modified guidance in some capacity due to the virus.
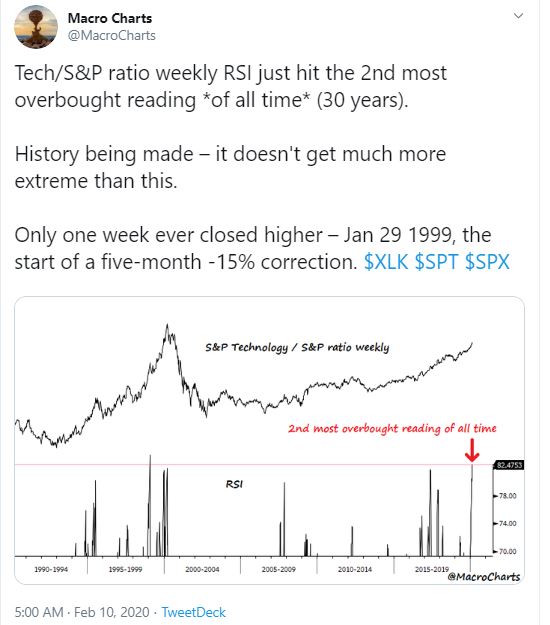
As well, there has been a cacophony of voices warning of the highly extended nature of the market advance. Macro Charts is just one of many examples.
SentimenTrader also provided a similar warning of market frothiness.
This is a market advance that is easy to hate, but it keeps rising.
A TINA advance?
I recently advanced the hypothesis that this is a TINA (There Is No Alternative) advance based on fear (see Why the market is rising on fear – Yes, Fear!). Global investors are piling into US equities as a safe haven because of coronavirus fears. US equities are becoming the last source of growth in a growth starved world.
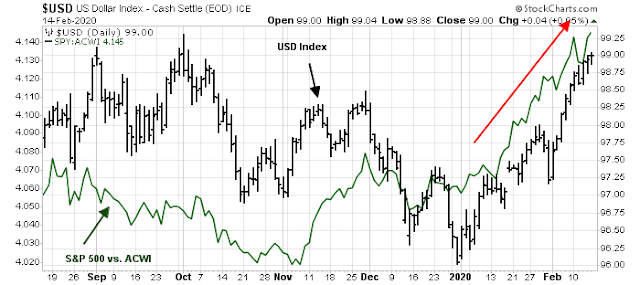
Despite the numerous bearish warnings, there is support for this hypothesis if you looked in the right places. The USD has been rising in lockstep with the relative performance of US equities, which is evidence of foreign buying.
US equity leadership is narrowing, as investors have been focused on larger cap NASDAQ and FANG stocks. I interpret this as foreigners buying US growth as a safe haven play.
More gains ahead?
Despite the bearish tone voiced by many analysts using conventional technical analysis techniques, the Advance-Decline Line made a new high last week, which is supportive of more gains.
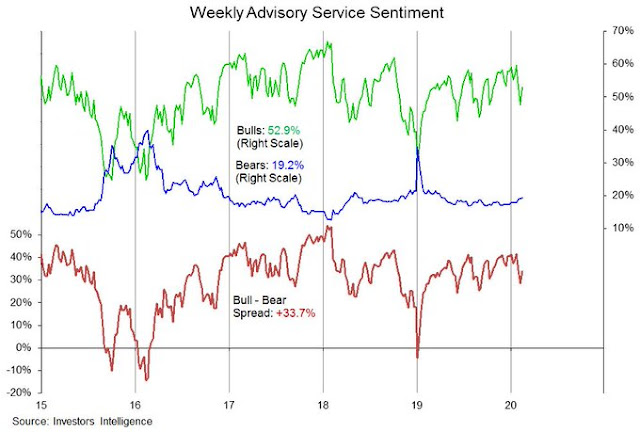
Many sentiment surveys are not flashing warning signs of bullish extremes. The AAII Bull-Bear spread is positive, but readings are nowhere near crowded long levels.
The same could be said of II sentiment. In fact, bearishness in this survey has ticked up, and major market tops generally do not occur with bearishness at these levels.
As well, the Fear and Greed Index ins in neutral territory. Where are the excesses?
The week ahead
This does mean, however, that traders can sound the tactical all-clear for the upcoming week. To be sure, next week is option expiry (OpEx) week. February OpEx has historically shown a bullish bias.
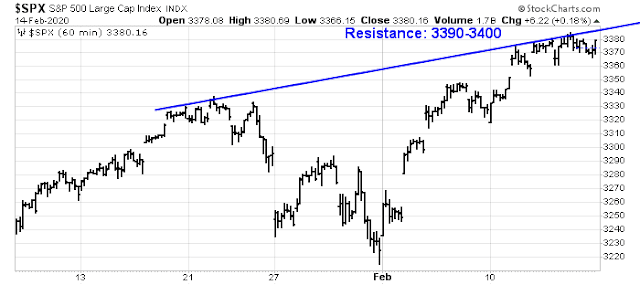
The hourly S&P 500 chart shows a steady grind up, with upside potential at the resistance level of 3390-3400.
Here is what I am watching. From a top-down macro perspective, flash PMIs will be released late next week, and supplier deliveries indicators and electronics PMIs will be the proverbial canaries in the coalmine, as any supply chain disruptions from travel restrictions and quarantines are likely to appear there first. Keep an eye on Taiwan export orders, Australia PMI, Thailand, and Hong Kong import data. Also watch for any changes in inventories from Chinese manufacturers, as well as imports by major auto, retail and durable goods companies, as signals of any impact from shutdown affecting the supply chain.
For an uncomplicated one-decision chart, I am monitoring the China Exposure Index, which measures the relative performance of stocks with the greatest exposure to Chinese sales. As long as this index is tanking, USD assets are likely to be well bid.
From a technical perspective, the market was sufficiently overbought, and short-term breadth indicators are recycling downwards. The market is ripe for a pullback.
The momentum factor is still rising, which is bullish. But the high beta to low volatility ratio may be rolling over, which would be bearish. Keep an eye out on how these factors evolves.
I conclude that the US equity market is being supported by strong foreign inflows. It is impossible to know how this situation will evolve, as the market is highly jittery and subject to headline risk. My inner investor is therefore neutrally positioned at the asset allocation weights specified by his investment policy.
My inner trader is bullishly positioned, but he is not inclined to add to his positions due to a combination of headline risk and possibly deteriorating technical conditions. He is keeping his stops tight.
Disclosure: Long SPXL









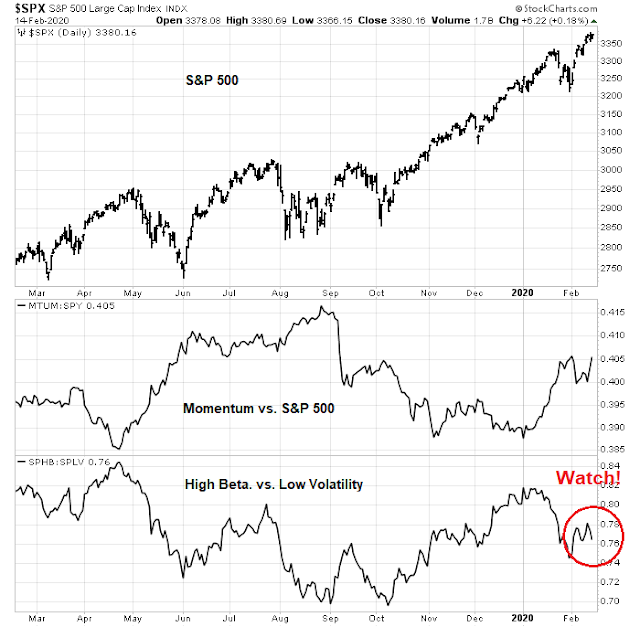
The SPHB:SPLV chart is not confirming the SPY higher highs, a negative divergence
A new thing is the huge surge in retail trading after the big discount trading firms have gone to zero commission on stock trading.
No idea the impact.
a lot of gambling on weekly options.
Here are a few developments about the China Bat Flu that have come to light recently. I think this will be an intermediate to long term negative for markets increasing news driven volatility. I fully think Cam is on the right track to monitor market changes/risks as this spreads.
1. The belief that the virus originated in a Chinese bio weapons lab that is now said to be about 300 yards from ground zero is gaining momentum. This probably will have little impact other than laying blame.
2. The virus can remain dormant in some people up to 24 days while they are still a contagion risk. I’m not sure if the virus test is working on these people.
3. The virus can re-infect people and cause them to have cardiac failure. I guess the re-infection is due to virus mutations and previous treatments that opened a path for re-infection. I don’t understand the latter but that is what doctors are saying.
4. Asians are more susceptible to the virus than Europeans due to the abundance of a certain enzyme in Asians.
5. The current test for the virus often comes back negative for those re-infected until late in the infection. A CT scan can show the virus in the lungs during this period when the test comes back negative.
I believe this will become a world wide pandemic by next year at the latest affecting economies beyond China and its effect on the world.
Wally you have a valid point. People vastly under-estimate the impact of this virus. Regarding your points above:
1. If the leak is verified, China will be sued into oblivion. But don’t believe China will pay.
2. HIV protein has been inserted in the DNA. I don’t think 24 days (or any length of time) is a valid quarantine mark. Remember how HIV virus can stay in the bodies for a long time without being detected.
3. Many bacteria and viruses remember your receptor protein structure once they gained access. Modern day analogy is block chain technology in the math applications. Any transaction will be imbedded in the chain. Sort of like having a key or combination in gaining access.
4. Unverified.
5.CT scan is not definitive. It can show the defects in the lung but cannot tell the causes. Currently the tests are repeated on the subjects. But the frequency and the test kit sensitivities are subject to change. In other words there are no guidelines, more like an ad hoc approach.
The biggest challenge in understanding this virus is the CCP stonewalling the investigation by CDC and WHO. So expect many false starts and more infection cases. If the world’s mood turns sour, the econ impact would be substantial. As a minimum, after the crisis is contained, the whole globalization concept will be redefined. A lot of supply chains will be realigned.
Because Cam always tempers his research with both viewpoints, read this article to calm down the fears (Maybe) about COVID-19. The article is written by a Mathematician, which should hold some water, especially on this blog where we are used to digging down with numbers.
https://www.nytimes.com/2020/02/18/opinion/coronavirus-china-numbers.html
Hopefully, Wally’s points stay theoretical and not become a reality.
Cam- Just wondering what you’re targeting as your ‘line in the sand’ for TLT.
I might ask, how are you thinking about the jump in TLT .vs. the big jump in gold today?