Mid-week market update: I am old enough to remember that one of the burning question for the January FOMC meeting was be whether the Fed would make a technical adjustment on Interest Paid on Excess Reserves (IOER) by 5 basis points. (They did).
Those were simpler times! The stock market rose relentlessly, day after day, and all was well in the land.
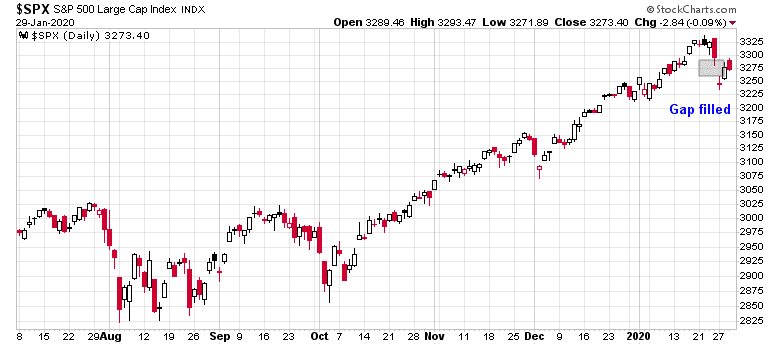
Now that stock prices have turned back up again as I had suggested (see Buy for the Turnaround Tuesday bounce), is it time to sound the all-clear and jump back into equities again?
Based on the historical experience, here are some questions that should be answered.
Down Friday/Down Monday
For some perspective on market history, Jeff Hirsch at Almanac Trader found an important historical pattern on what he called “Down Friday/Down Monday”. Most of the time, this pattern proved to be ominous, except when it wasn’t:
Today’s retreat triggered the first DJIA Down Friday/Down Monday of 2020. The combination of a DJIA Down Friday* followed by a Down Monday** has been a rather consistently ominous warning, but they have also occurred at significant market inflection points (interim tops and bottoms). The last occurrence was in August of last year. That declined proved to be a good entry point for new long positions as the market enjoyed a solid rally through the end of the year.
How can you tell the difference? According to Hirsch, here is the key “tell”:
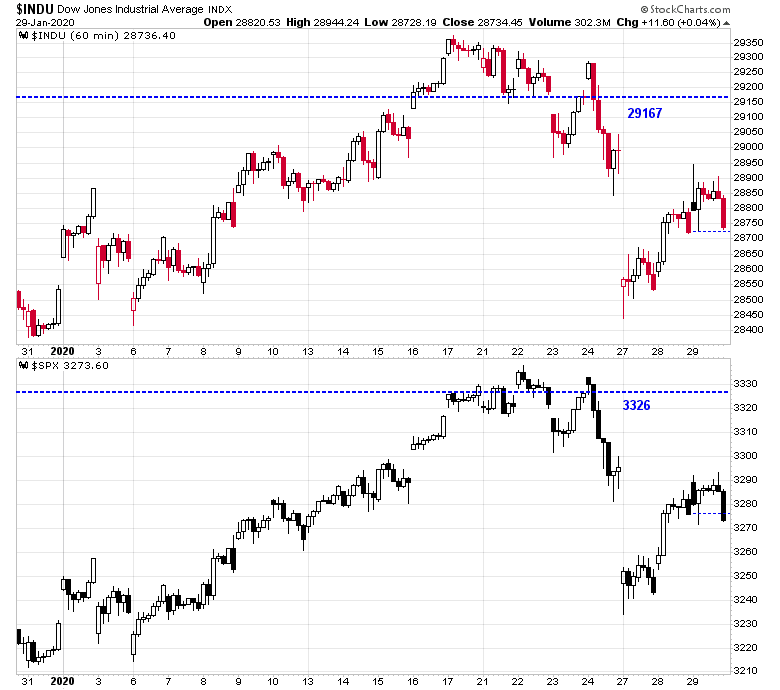
if DJIA recovers its recent losses within about 4-7 trading days, then the DF/DM that just occurred was likely the majority of the decline. However, if DJIA is at about the same level or lower than now, additional losses are more likely sometime during the next 90 calendar days.
In other words, price momentum will tell the story. As guidelines, the DJIA has to recover back to 29167 and SPX has to recover to 3326 by next week. Otherwise the odds favor another leg downwards.
Remember sentiment?
Another key question for investors and traders is the evolution of sentiment, particular fast money sentiment and positioning. I wrote on the weekend (see A market stall?) that a market decline was more or less inevitable due to excessive hedge fund bullish positioning.
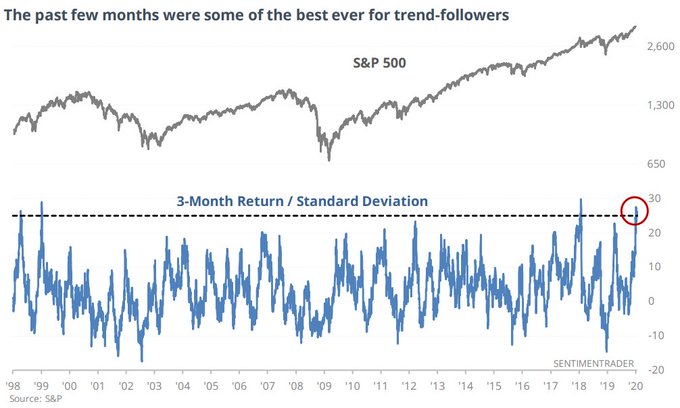
Risk-adjusted returns, as measured by 3-month equity returns divided by standard deviation has one of the best readings dating all the way back to 1928. This is attributable to two factors. The stock market has been rising steadily, and the low realized volatility of the market, which has encouraged risk taking by hedge fund traders. Positioning is now at a crowded long, which makes the market vulnerable to a setback. Should prices start to recycle downwards, the potential for a disorderly unwind of long positions is high.
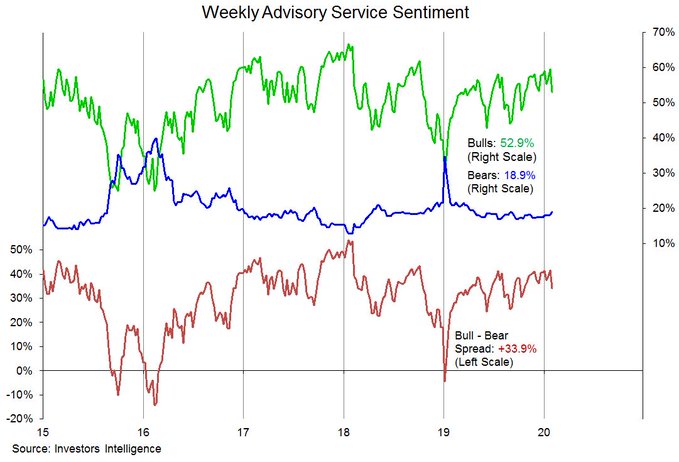
Now that the risk unwind appears to have begun, how has sentiment evolved? While it’s difficult to get any real-time estimates of hedge fund positioning, there are some updates of sentiment that may be useful. The latest update of II sentiment shows some retreat in bullishness, but readings are still elevated.
Callum Thomas has conducted an (unscientific) weekend Twitter poll since mid-2016, and the survey provided a snapshot of sentiment on the weekend when the anxiety over coronavirus infection was at its height. The survey showed equity bullishness plunged to near all-time lows. However, it would be highly unusual for the market to turn up based on a one-week precipitous decline in bullishness. Wait for the 4-week average to catch up to lower levels of bullishness.

That said, cratering bullishness has historically been associated with VIX readings of over 20, which has not occurred yet.
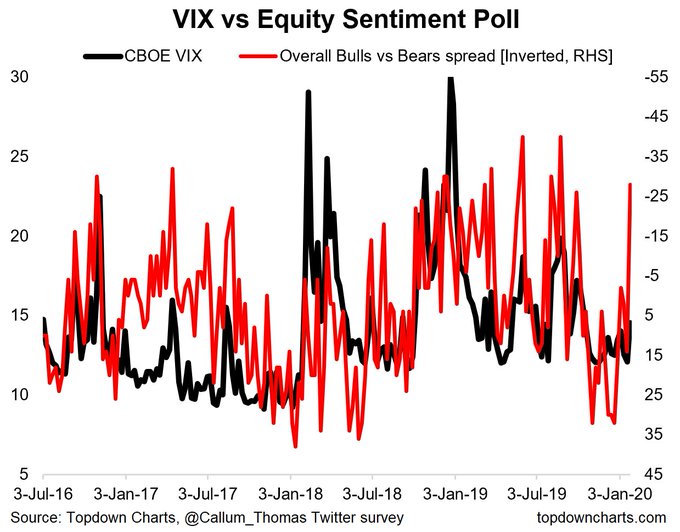
The bulls have not suffered enough pain yet. We need more for capitulation to occur.
Market internals
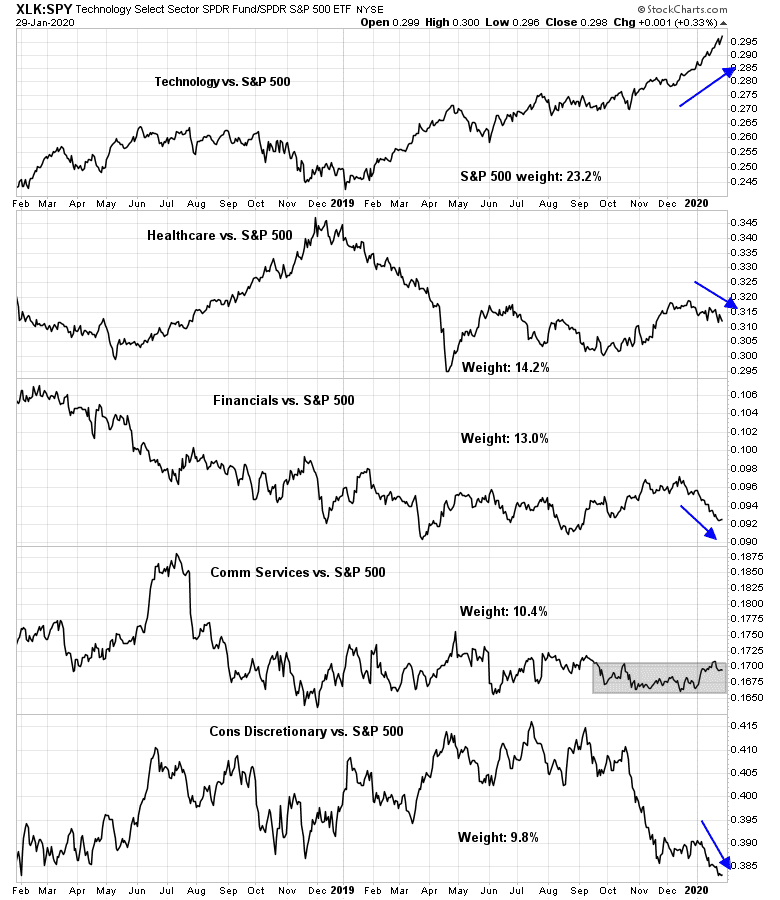
A review of the relative strength of the top five sectors reveals a weakish picture. As a reminder, the top five sectors comprise nearly 70% of index weight, and it would be difficult for the market to make a major move without the participation of a majority of these sectors. Of the five sectors, only one (Technology) is unambiguously bullish, one (Communication Services) is neutral, and the other three are bearish. This gives the market a slight bearish tilt, though the market is volatile, and leadership shifts can happen at any time.
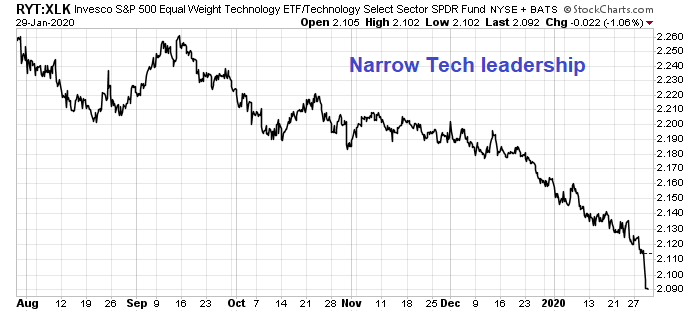
Looking beneath the surface, even the strength of Technology stocks is problematical. An analysis of the equal vs. cap weighted performance of technology stocks shows that the equal-weighted to cap weighted ratio within the sector is tanking. This is a sign of narrowing leadership by large cap FAANG stocks.
Further breadth analysis of the top five sectors also reveals how market breadth has deteriorated. Net highs-lows are all falling, and one sector (Communication Services) is showing negative net highs-lows. Can the market rally to new highs with internals like this, or are these signs of an oversold bottom?

In conclusion, the weight of the evidence indicates that the market has unfinished business left to the downside. My inner trader took partial profits on his short positions on Monday (see Buy for the Turnaround Tuesday bounce), but he remains short the market.
Disclosure: Long SPXU
Correction:
“As guidelines, the DJIA has to recover back to 29167 and SPX has to recover to 3226 by next week. Otherwise the odds favor another leg downwards.”
Should read:
“As guidelines, the DJIA has to recover back to 29167 and SPX has to recover to 3326 by next week. Otherwise the odds favor another leg downwards.”
The 3226 has been changed in both the text and the chart. I apologize for the error.
If you look at the channel from the oct 2019 low, a 50%correction would be around 3110. This also meets the line through the tops from jan 2017, and also would enter a congested zone of the July and sept 2019 tops and the December 2019 lows…to me that is a target of interest
Incubation period of corona virus will dictate the headline risk, globally, as new cases emerge in Western Countries. Eventually, WHO may declare a global pandemic. Time and Economist magazines may have cover pages of the Corona virus particle that may mark the bottom of this pull back.
I do not know if this is how it will happen, but is just a speculation at this point. A bounce off of 3025 (previous double top), August to October peaks, would be a good outcome, if it were to happen, reconfirming an ongoing bull market. May take till early March (see Cam’s previous post of Sars timeline, last week).
This may no longer have anything to do with the Coronavirus. The most disturbing virus I see is the “temporary” inversion of the 1mo, 3mo and 6mo Treasury Bills with the 10yr Note. What is that all about?
This is good article on what’s happening in China in view of Coronavirus. Not sensationalism, just plain facts. Gives me hope that the spread of the virus will be contained sooner rather than later.
https://www.huffpost.com/entry/wuhan-coronavirus-china-experience_n_5e32ed53c5b69a19a4ab3a04