Preface: Explaining our market timing models
We maintain several market timing models, each with differing time horizons. The “Ultimate Market Timing Model” is a long-term market timing model based on the research outlined in our post, Building the ultimate market timing model. This model tends to generate only a handful of signals each decade.
The Trend Asset Allocation Model is an asset allocation model which applies trend following principles based on the inputs of global stock and commodity price. This model has a shorter time horizon and tends to turn over about 4-6 times a year. In essence, it seeks to answer the question, “Is the trend in the global economy expansion (bullish) or contraction (bearish)?”
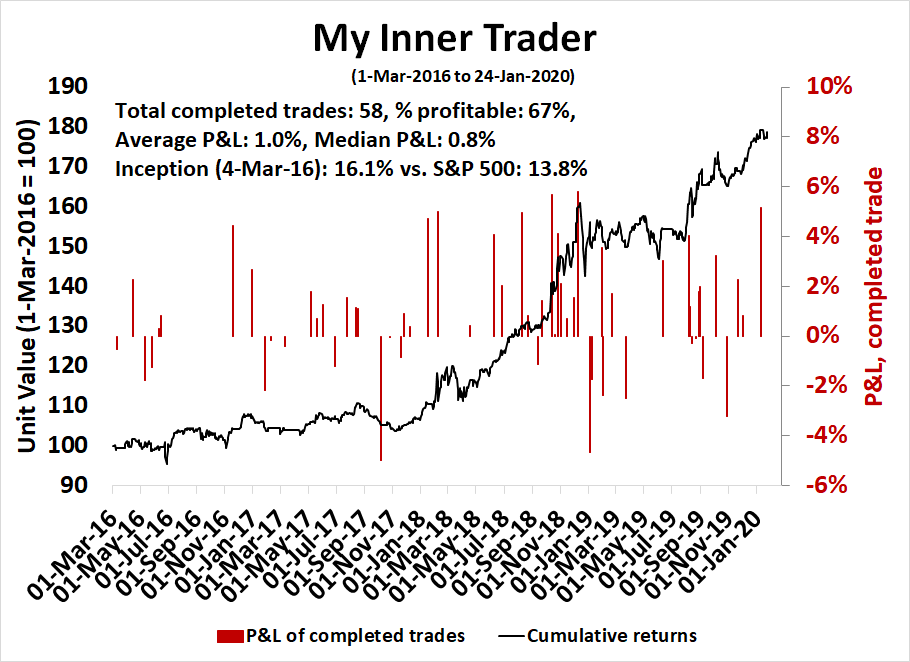
My inner trader uses a trading model, which is a blend of price momentum (is the Trend Model becoming more bullish, or bearish?) and overbought/oversold extremes (don’t buy if the trend is overbought, and vice versa). Subscribers receive real-time alerts of model changes, and a hypothetical trading record of the those email alerts are updated weekly here. The hypothetical trading record of the trading model of the real-time alerts that began in March 2016 is shown below.
The latest signals of each model are as follows:
- Ultimate market timing model: Buy equities
- Trend Model signal: Bullish
- Trading model: Bearish
Update schedule: I generally update model readings on my site on weekends and tweet mid-week observations at @humblestudent. Subscribers receive real-time alerts of trading model changes, and a hypothetical trading record of the those email alerts is shown here.
A market stall?
For the last two weeks, I have been warning about the extended nature of the stock market (see Priced for perfection and Froth everywhere!). Now that the advance is pausing over concerns the Wuhan coronavirus, is this the start of a market stall?
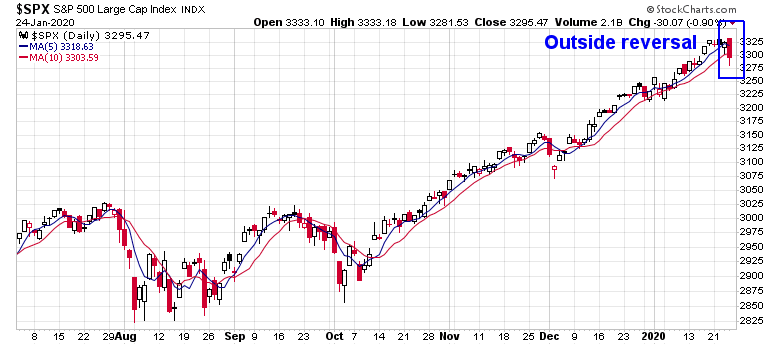
It’s starting to look that way. The SPX violated its 5 and 10 day moving averages, and printed an outside reversal day. These are all indications of a possible change in trend.
Here are bull and bear cases.
The bear case
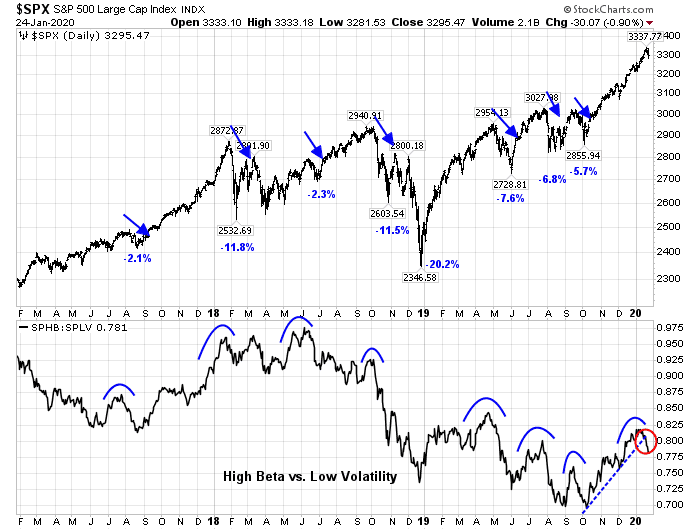
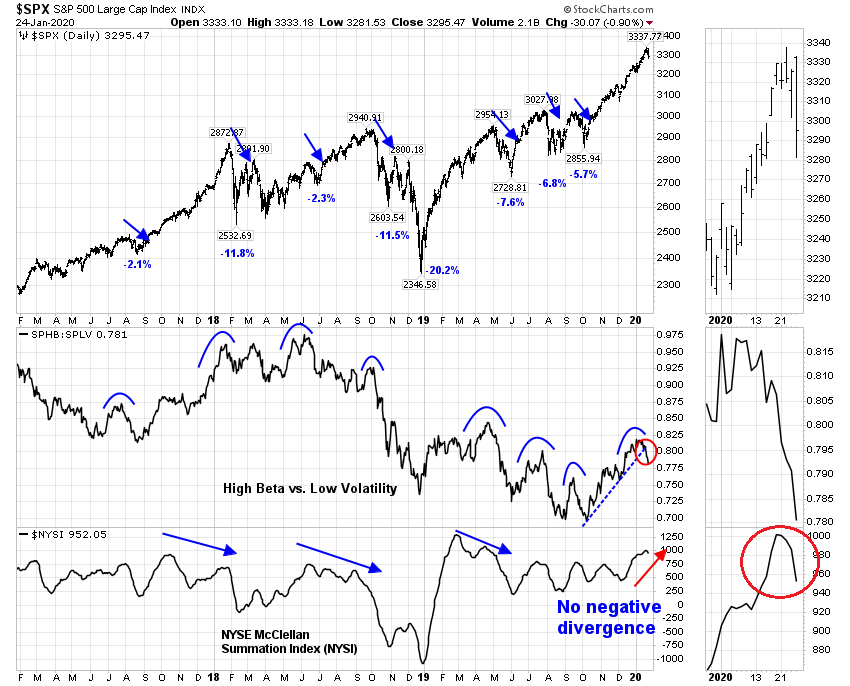
Let’s start with the bear case, which is more obvious from a tactical perspective. First, equity risk appetite as measured by the ratio of high beta to low volatility stocks has rolled over. This has been a reliable trading signal in the past of market weakness.
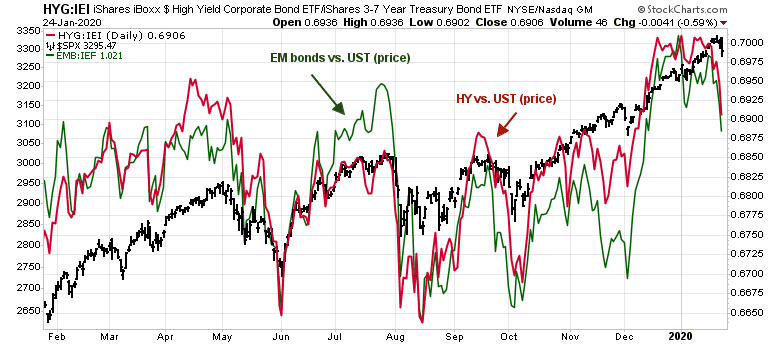
The signal from credit market risk appetite is similarly worrisome. Both high yield and emerging market bonds are underperforming their duration-equivalent Treasuries. While these indicators are tracing negative divergences to equity prices, their readings have tended to be volatile.
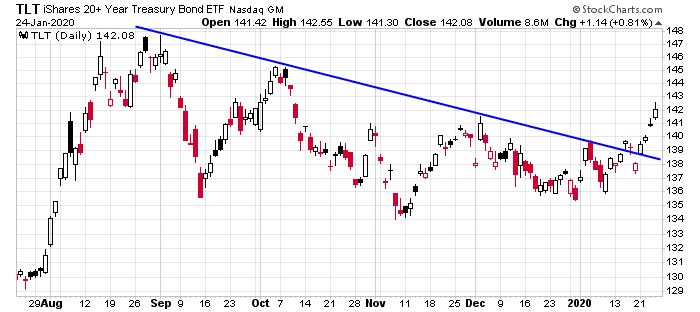
The price of the long Treasury ETF has staged an upside breakout from a falling trend line. Rising Treasury prices are an indication of diminished risk appetite, which is equity bearish.
The bull case
While bearish red flags are beginning to be raised, there are a number of neutral to bullish indicators to consider. The USD Index has staged an upside breakout out of a multi-year base, and it is tracing out a bull flag formation. Should the USD break out of the bull flag, it would be bearish for emerging market assets, and therefore negative for risk appetite. Keep an close eye on the greenback. The jury is still out on that question.

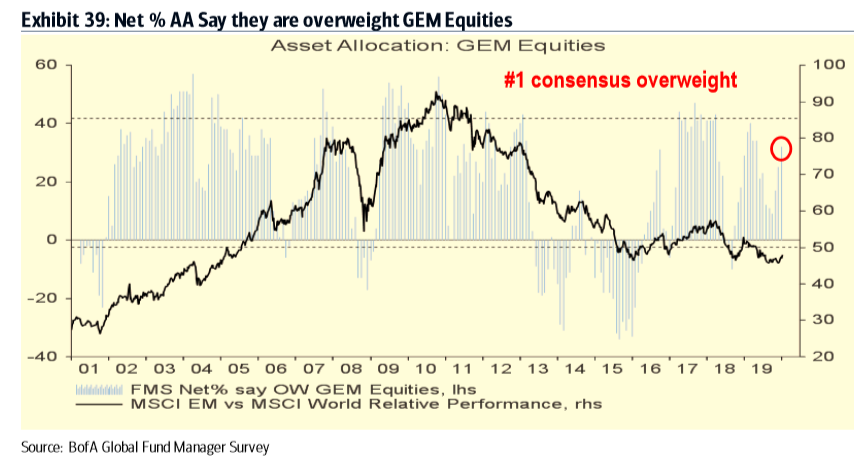
The latest BAML Global Fund Manager Survey shows that EM is the largest equity overweight position among managers. A USD rally and EM retreat has the potential to cause the maximum amount of pain, and a disorderly unwind and risk-off stampede.
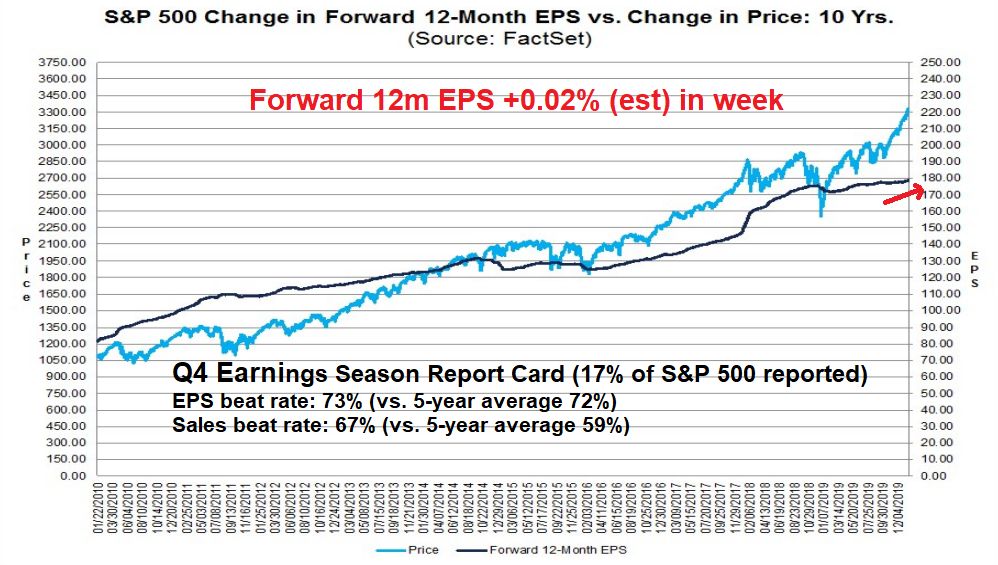
The latest update from Q4 earnings season remains upbeat. EPS and sales beat rates are neutral to positive relative to history. More importantly, forward 12-month earnings estimates are rising, indicating positive fundamental momentum. However, the magnitude of the EPS beats was slightly disappointing. They came in at a rate of 3.2% above expectations, which is below the 1-year average of 4.5% and 5-year average of 4.9%.
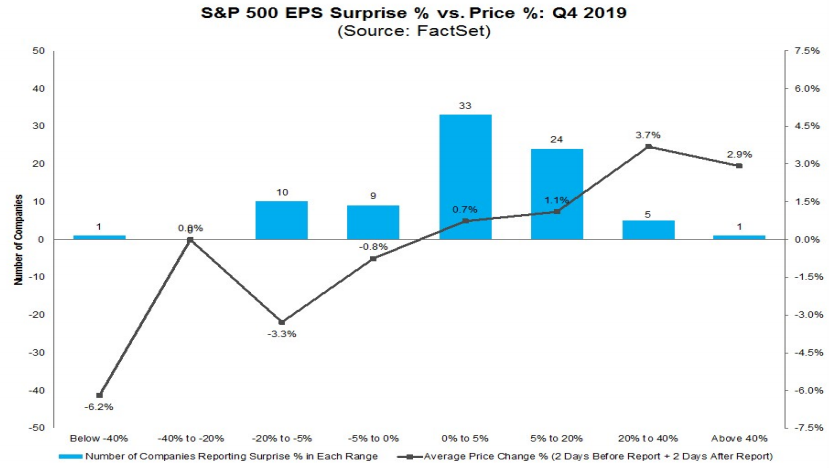
Just as importantly, the market is behaving as expected by rewarding EPS beats and punishing misses.
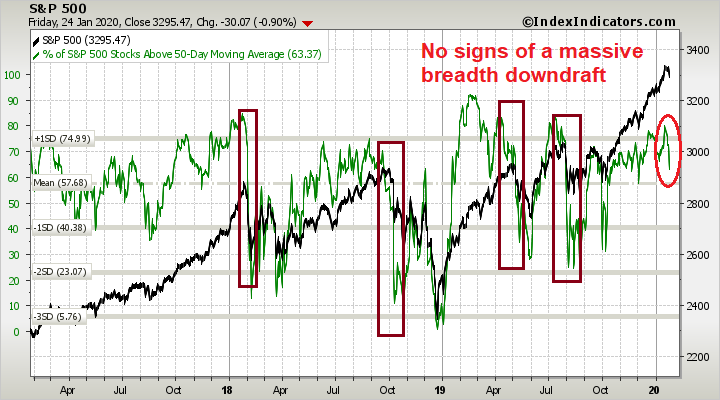
Breadth and momentum indicators are still strong. The % of stocks above their 50 day moving average is not behaving in a way similar to past major market plunges. Arguably it is still early and this indicator could fall dramatically in the near future.
As well, NYSI has barely begun to roll over. Past major market tops have been characterized by negative divergences in NYSI, which is not evident this time. In the past, rollovers by the high beta to low volatility ratio have been followed by 5-10% corrections, but this time could be different. The possibility exists that, in the absence of a NYSI negative divergence, any pullback could be shallow in the order of -2%. This would be followed by a market rally and negative NYSI divergence that marks the final top.
The verdict
After considering the bull and bear cases, what’s the verdict?
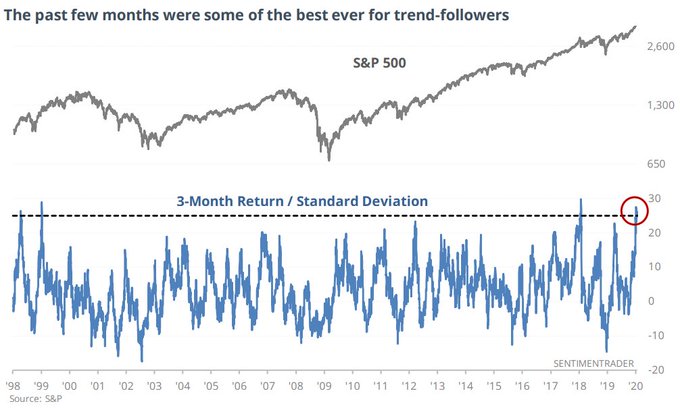
The recent market melt-up was characterized by excessively bullish sentiment and a bullish stampede by traders. This chart from SentimenTrader (via Andrew Thrasher) makes a great point. Risk-adjusted returns, as measured by 3-month equity returns divided by standard deviation has one of the best readings dating all the way back to 1928. This is attributable to two factors. The stock market has been rising steadily, and the low realized volatility of the market, which has encouraged risk taking by hedge fund traders. Positioning is now at a crowded long, which makes the market vulnerable to a setback. Should prices start to recycle downwards, the potential for a disorderly unwind of long positions is high.
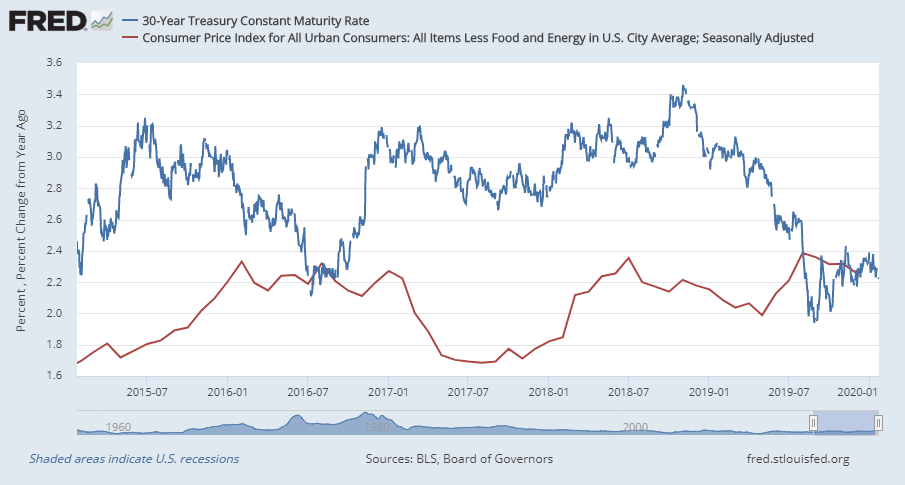
For a longer term perspective, consider the evolution of long bond yields. The 30-year Treasury yield has staged a recent tactical retreat, but the level of macro concerns outside of the Wuhan coronavirus is relatively low compared to past episodes of falling bond yields. Indeed, the St. Louis Fed Financial Stress Index hit an all-time low, and the Chicago Fed National Conditions Index isn’t that far behind.

This is compressing real bond yields, which is bullish for gold, and the reflation trade. My interpretation is that while the market is at risk of a short-term pullback because of excessive risk positioning, investors should consider market weakness to be an opportunity to buy the reflation trade.
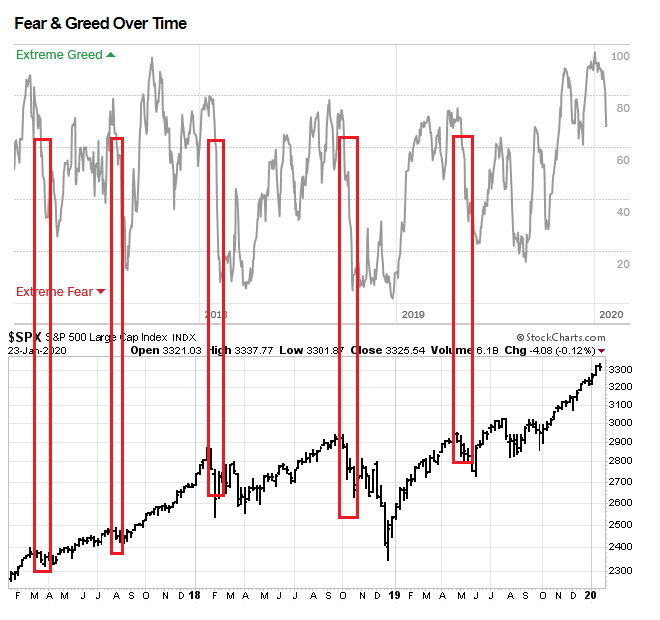
In the short run, we may not be at a tipping point in the market just yet. In the past, significant market downdrafts have not occurred without the Fear and Greed Index recycling from above 60 to below the 60 mark. While we are close, that bearish tripwire has not been triggered yet.
While I am leaning towards a bearish resolution, the signals of a major downdraft are not yet in place. Traders could dip their toes in the bearish pond, and await further developments. My inner trader had already initiated a short position, and he raised his shorts when the market violated its 5 dma on Friday.
While my inner trader is tactically bearish in his trading account, the week ahead may not be as easy as anyone thinks. Earnings season is in full swing, and a host of macro releases could have market moving consequences. The Fed and the BoE meet next week. We will also see the US and the eurozone report initial estimates of Q4 GDP, and China will report its official PMI.
Consequently, the week ahead could be very volatile and difficult to navigate from a trader’s perspective. Monday could see further downside as the weekend news is filled with stories of the seriousness of the Wuhan coronavirus. The market is already mildly oversold as of Friday’s close, and could see a Tuesday turnaround after more weakness on Monday.

Keep an open mind, and adjust the size of your trading positions to the expected heightened volatility.
Disclosure: Long SPXU
“If you can keep your head when all about you
Are losing theirs and blaming it on you,
Then you don’t understand the problem.”