Mid-week market update: My trading model has turned bullish, and there are plenty of signs that the market is ripe for a relief rally. There was the CNBC Markets in Turmoil program Monday, which as SentimenTrader pointed out, tends to mark short-term bottoms.
As well, the McClellan Oscillator (NYMO) fell to levels on Monday that are consistent with past tradable bottoms.
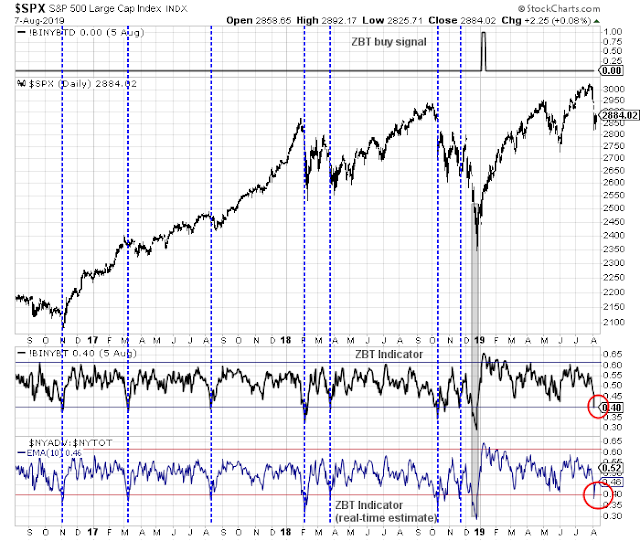
The Zweig Breadth Thrust indicator also provided signs of a short-term bottom. The ZBT buy signal consists of two components. First the market has to become oversold, and then it has to rally into an overbought condition into a short period of time. In the past, an oversold condition (vertical lines) have been a reasonably good signals that a rally is imminent. The market achieved the oversold signal on Monday.
A study of recent ZBT oversold signals shows that the length of the subsequent rallies have lasted between one day to two weeks, with one week being the best estimate. Subscribers received an alert today indicating that my trading account had bought the market. I expect this rally to last about a week, and I will exit the long position early next week.
If you did jump on the long trade, another way of timing the exit is to monitor the % above 5 dma indicator. Wait for it to recover back into an overbought condition, just as it did during past episodes where the market fell to an initial low and then recovered as part of a longer term correction.
Unfinished downside potential
My base case scenario calls for a rally, and then more weakness ahead. John Murphy at Stockcharts (paywall) pointed out that the market lacks sector breadth participation:
SECTOR BREADTH ISN’T BROAD ENOUGH…One of the ways to measure the strength of the stock market’s uptrend is to see how many of its eleven sectors have hit new highs with the major stock indexes. In a strong uptrend, most market sectors should be confirming the market’s move to a record high. Unfortunately, that’s not the case this year. In fact, six of the eleven sectors have fallen short of record highs. And most of ones that have hit highs are defensive in nature. That’s not a good sign either.
Five market sectors have hit record highs this year. Three of them are bond proxies like REITs, utilities, and consumer staples. All three are also defensive in nature and usually lead major market advances in the late stages of a bull market. The two others to hit new highs are consumer discretionary, which is more economically-sensitive, and technology. Tech traditionally does better when investors are looking for growth that isn’t available elsewhere. That’s not exactly a vote of confidence.
The stochastics on the weekly SPX chart has barely begun to flash a sell signal. At a minimum, I would like this indicator to retreat to at least 50, or neutral territory.
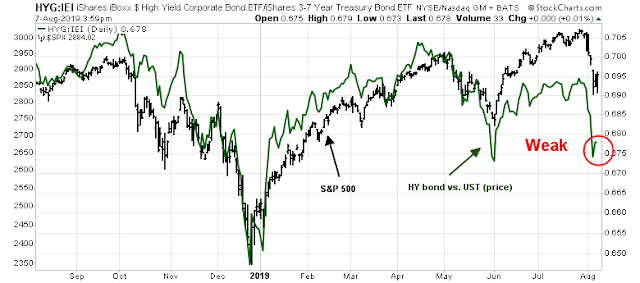
Credit market risk appetite is not confirming the rebound. The relative performance of high yield (junk) bonds to duration-adjusted Treasuries continues to lag.
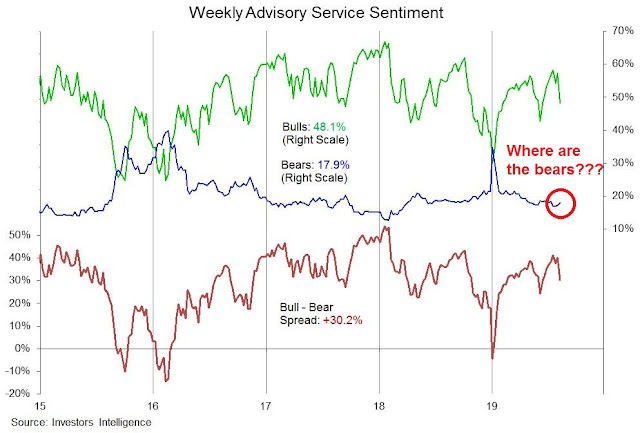
Sentiment has begun from an excessive bullish level, but readings have not capitulated to excessively bearish levels yet.
After Monday’s close, I conducted an (unscientific) Twitter poll of short and longer term sentiment. The one-week outlook was tilted slightly bearish.
The longer term three-month outlook is far too sanguine. While I recognize the limitations of Twitter polls, these results, combined with the II sentiment survey, leads me to believe that the market is in need of a further decline before sentiment can properly reset.
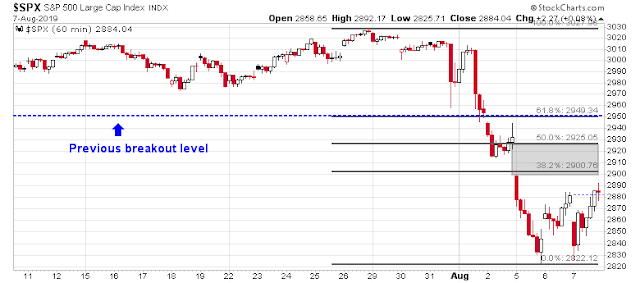
Tactically, I am looking to scalp some short-term profits into next week. The initial upside objective is to fill the gap between 2900 and 2925, which happens to be two Fibonacci retracement levels. Additional resistance can be found at 2950, which coincides with another Fibonacci retracement objective, and the site of the past breakout and resistance.
My inner investor remains neutrally positioned. My inner trader just went long the market today for a scalp, and the trade should last for about a week.
Disclosure: Long SPXL


Thanks Cam. May I ask about your views on where the SSEC is going medium-long term?
The Shanghai market is really outside my core competency, and your guess is as good as mine.
I can say that the Chinese stock market is dominated by retail investors, which is very different from the US or European markets. Therefore it will be prone to more volatility.
Kevin-
SentimenTrader unlocked this morning’s blog post (for a limited time), which contains information that seems relevant to your question.
https://www.sentimentrader.com//blog/thursday-color-islands-emerging-streak-breadth-signs-of-anxiety-gold/
Thanks
Are you planning to hang in there, Cam? The move above SPX 2925 seems to be driven by shorts, and once they’re done it becomes a high(er)-odds fade?
Put/call ratio still elevated and above 1. Market climbing the proverbial wall of worry today (Thu). Likely more upside tomorrow.
On the HYG/IEI chart it says “”UST””.
What is UST?
US Treasury (3-7 years, in this case).
Thank You.