Mid-week market update: I have been cautious about the US equity market outlook for some time, and the market seems to be finally rolling over this week. The SPX violated an uptrend while failing to rally through resistance.
In the short rim, stock prices are likely to experience difficulty advancing. However, such episodes of trend line breaches can either resolve themselves through a sideways consolidation or a correction. What is the more likely scenario?
A mixed leadership message
An examination of sector market leadership doesn’t yield a lot of clues. The top four sectors, Technology, Healthcare, Financials, and Communication Services, make up roughly 60% of the weight of the index. However, their relative performance doesn’t give us many clues to the market direction. Financial stocks, whose relative performance is highly correlated to the shape of the yield curve, is performing roughly in line with the market. Technology is strong, but its strength is offset Healthcare weakness. Communications Services, which is dominated by FB, GOOGL, and NFLX, is not confirming Tech leadership, indicating mixed FAANG participation in this rally.
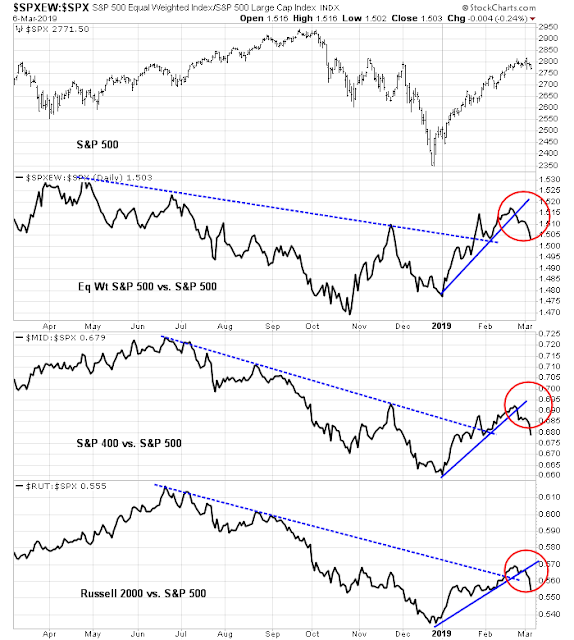
The picture from market cap leadership is a bit more worrisome. Mid and small cap stocks have been the leaders in the latest rally, and all metrics of market capitalization indicate small and mid cap strength are rolling over. However, this may only be a signal that stock prices are struggling at resistance. It does not necessarily mean they will correct.
The silver lining
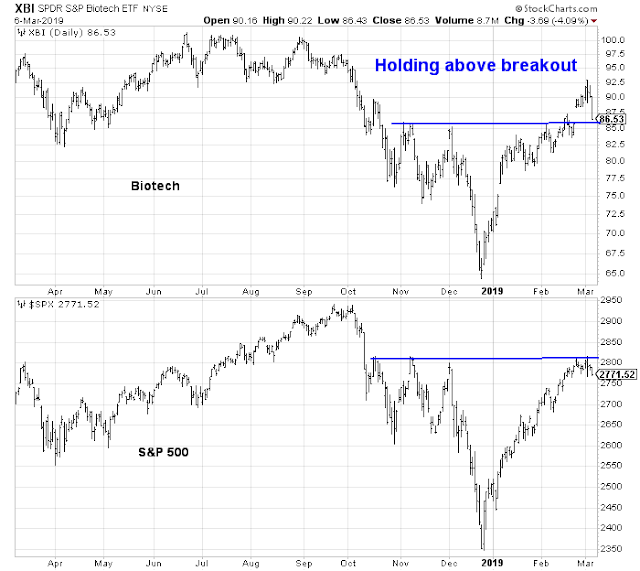
There are, however, some silver linings in the dark cloud. Biotech stocks have led this market upwards, and the group staged an upside breakout through resistance when the major indices failed. So far, Biotechs have pulled back but they are still holding above resistance turned support. That’s a good sign.
The SPX breached its 10 dma today after a prolonged advance. Statistical analysis from Troy Bombardia indicates that such episodes tend to be short-term bullish, though the market is down 62% of the time after three months.
The bear case
On the other hand, there are plenty of ominous signals. The most worrisome has been the inability of stock prices to respond to good news. We have seen a couple of instances where Asian markets have risen on the news of an imminent US-China trade deal. US equity futures rise overnight, only to see the strength fade away during regular trading hours.
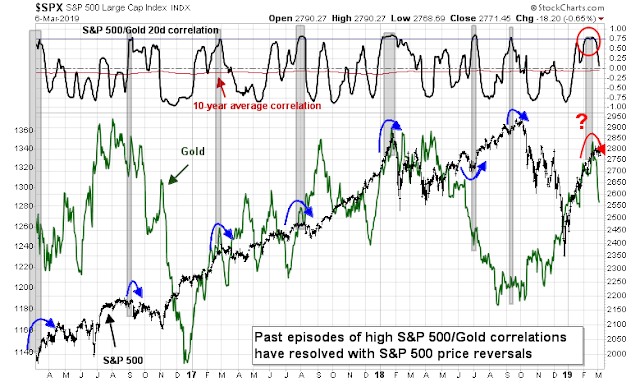
I pointed out before that stock and gold prices have been unusually correlated in the rally off the December bottom. Such instances of high correlation tended to be resolved with a stock price reversal, which we seem to be seeing the beginning of.
The strength of the USD is also a concern. Roughly 40% of SPX revenues are foreign, and USD strength creates an earnings headwind for multi-nationals. Past episodes of excessive USD strength have resolved themselves with stock market weakness.
As well, Mark Hulbert recently warned that his index of NASDAQ market timers are in their 96 percentile of bullishness, which is contrarian bearish:
The rally since Christmas Eve has indeed been sharp and powerful. Investors’ hopes have been rekindled in a big way. The Hulbert Nasdaq Newsletter Sentiment Index (HNNSI), which measures the average recommended exposure level among Nasdaq-oriented market timers, recently rose to one of its highest levels ever — higher than 96% of daily readings since 2000, in fact.
This does not bode well for the market’s near-term prospects, according to contrarian analysis. To repeat: none of this discussion automatically means we’re in a bear market. We won’t know for sure, one way or the other, until the market averages either surpass their bull market highs from last fall or break down below their Christmas Eve lows. But it definitely isn’t a good sign that so many bulls are prematurely declaring victory.
The last word
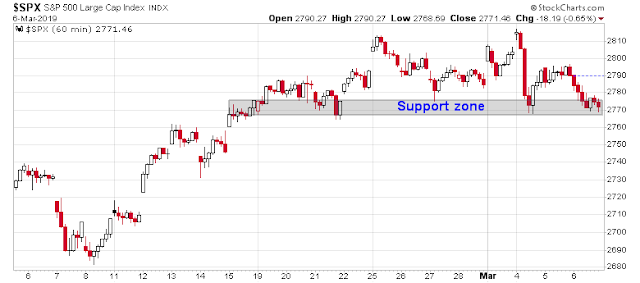
Where does that leave us? My inner trader is still tactically bearish, but he is keeping an open mind as to near-term market direction. While he is tilting towards the correction case, he is not ready to get wildly bearish until the SPX decisively breaks support on the hourly chart.
Disclosure: Long SPXU


Check this out;
https://www.marketwatch.com/story/this-bull-market-is-10-years-old-try-three-months-2019-03-07
D.V.
Thanks for the link. But after reading his opinion, He seems to want to have it both ways. In the link that Cam provided Hulbert is talking about Bear and in the other he is talking about Bull. So, overall, he does not have a conviction one way or the other and seems to be hedging both ways so that he can claim being prescient based on which way the wind blows.
I noticed IBB looked a lot worse, with support breaking pretty badly… (.vs. XBI)
” While he is tilting towards the correction case, he is not ready to get wildly bearish until the SPX decisively breaks support on the hourly chart.”
Cam, looks like your support level has been violated, is your analysis intra-day or market close based?
Thanks
Mike
It’s based on the close, but in this case I think we can call the downdraft “decisive”.
Thank you, stay well!