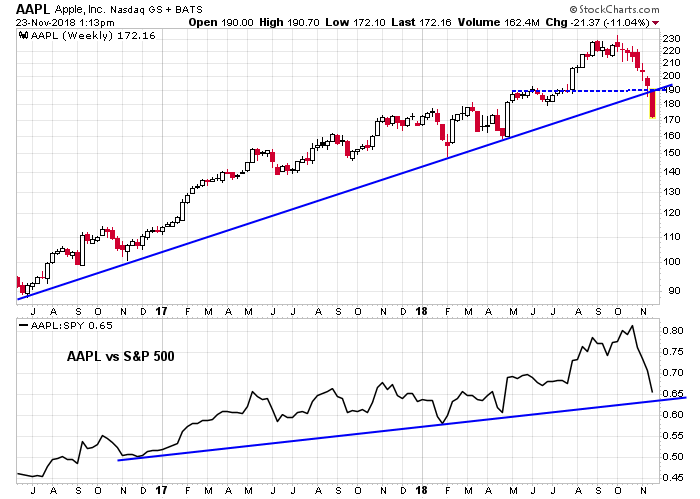
I normally don’t comment on individual stocks because I don’t have the resources to analyze a zillion companies in detail, but here is a Black Friday thought on Apple, which kicked off a revolution in consumer electronics and created new product categories when it unveiled its iPods, IPads, and iPhones. The share price of Apple have cratered on reports of poor iPhone sales. The chart is a bull’s nightmare. It broke down through the 190 key support level, and violated a long-term uptrend.
In some ways, AAPL is turning out to be a Rorschach test for investors and traders.
Different perspectives on AAPL
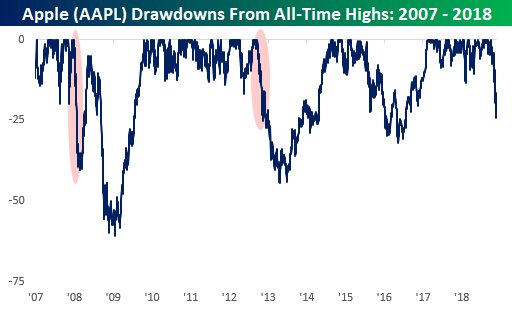
Bespoke`s chart depicts the history of the stock’s drawdowns since the inception of the iPhone. Is the current weakness a buying opportunity, or the signs of a busted growth stock that should be sold?
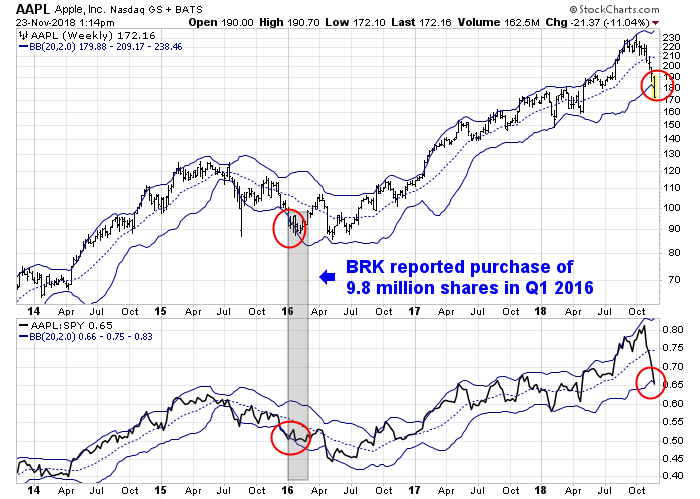
For a longer term perspective, Warren Buffett’s Berkshire Hathaway reported its first purchase of Apple in Q1 2016 when it bought 9.8 million shares. Berkshire has been steadily accumulating Apple shares all the way up, and it now holds roughly 250 million shares. It’s a big bet for Buffett, as the stock represents 26% of the Berkshire portfolio. Buffett initiated his buy program when the stock at its lower weekly Bollinger Band, both on an absolute and market relative basis, which is the same technical position it is in today.
Is AAPL a buy or a sell? How you answer that question reveals more about yourself than the outlook of the stock.
“Is AAPL a buy or a sell? How you answer that question reveals more about yourself than the outlook of the stock.”
I just love that statement.
If the G20 doesn’t produce a truce in the China Trump trade war, Apple is a sell. It is the poster child of international supply chains and an iconic American brand.
We may see some hopeful signs that may give us hope for a de-escalation of the trade war and Apple could bounce but if nothing meaningful is agreed, any rally would be a shorting opportunity.
I still think American nationalism will hurt international sales of American products as the trade war heats up.
We’ve started a bear market and this is just the opening act.
Who says Buffett doesn’t look at the technical charts when he trades? Somebody from Berkshire certainly did. Buffett’s entry point you see in 2/2016 was months following the ‘death cross’ spike down from 8/2015 at which point the 50 day MA bottomed and AAPL eventually recovered from the death cross around 8/2016. Cam doesn’t show this, but a similar death cross in AAPL occurred from 11/12 to 9/13. In both cases it took 9 months to a year before Apple recovered and that is probably what a prudent investor would do with the stock because there seems to be little to be gained by anticipating where that point would be.
PS. I think it is spelled ‘Rorschach’ Cam, and no, I don’t see any Rorschach in this one, just the technicals. Keep up the good work.
The AAPL chart is not the only big cap tech name that decisively violated important trendlines on their weekly chart. The lack of a countertrend rally this week should be a warning. AMZN did not manage to rally with Black Friday and their biggest tech event coming up. MSFT has held up relatively well but finally violated an important trendline on the weekly chart. NFLX chart also “broke down”. All those stocks would have needed a bounce this week that failed to materialize, I think it will be difficult for the indices to rally with those stocks breaking down.
There is speculation about Fed slowing, Morgan Stanley and others are calling for dollar weakness and we have Trump & Pence setting up what looks like a good cop, bad cop approach. Why have US multinationals been trading so poorly this week? More patience required or disturbing signal? If mega cap momentum winners like AAPL, BA, MSFT, AMZN and others are getting sold it will be difficult for other sectors to outweigh that. XLF, XLB, XLE and XLC all had bad weeks.
there is a channel from 2007…goes through all the major tops and bottoms…tops of 07, 12,15 and this year it popped above the channel. Now it is back in the channel, So will it bounce around back inside the channel? The bottom of the channel is near the top of 2015 which could be support also. That still represents a steep drop.
I think we are going down to the 2009 trend line at 2200 …would like to hear the groups thoughts and have a blessed weekend !
I think we are going to test that 2200 level on the trend line as well. Exactly what I’ve been thinking. Question is, will the test be successful. It depends on what unfolds with the trade war and other issues.