Mid-week market update: For a change, I thought it was more appropriate to write about bond yields instead of the usual tactical trading commentary about stock prices on this FOMC day.
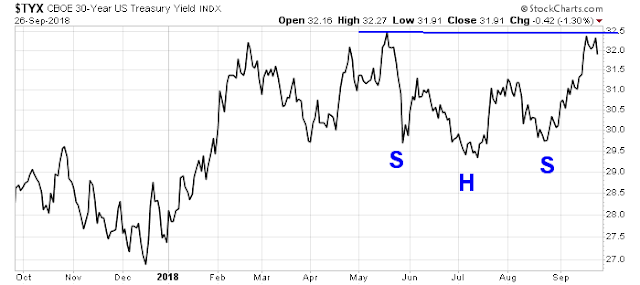
Increasingly, there has been more and more bearish calls for bond prices (and bullish calls for bond yields) as the Fed continues its rate normalization program. Some analysts have pointed out a nascent inverse head and shoulders formation on the 30-year yield (TYX). With the caveat that head and shoulders formations are never complete until the neckline is broken, a decisive upside breakout in TYX would be bad news for long Treasury prices.
I would argue against an overly bearish view for bonds. At a minimum, bond yields are unlikely to rise as much as expected, and they may actually decline slightly from current levels.
The historical record
Here is the long-term perspective on bond yields. The chart below depicts the 10-year Treasury yield compared to nominal GDP growth. We can make two observations from this chart:
- The two series have tracked each other fairly closely, in an albeit noisy manner, in the past.
- Bond yields underpriced inflation since the 1960`s, but the underpricing ended during the Volcker Fed era.
The bond bears will argue that the post-GFC period of QE and financial repression is also underpricing bond yields. Therefore the Fed`s gradual normalization is therefore bullish for yields and bearish for bond prices.
Let`s unpack that analysis. First, we can observe that the 10-year yield has closely tracked real GDP growth this cycle. Tactically, betting on a regime shift where yields normalize to some higher premium level amounts to a “this time is different” bet. Do you really want to do that?
To be sure, nominal GDP is composed of real GDP plus inflation. There is little doubt that inflation, and inflationary expectations are rising. On the other hand, I can’t see how real GDP can sustain the current torrid rate of growth seen in 2018.
The recent FT Alphaville post “America’s economic sugar high is starting to wear off” tells the story of fading growth tailwinds from the tax cut bill.
No binge ends well. Whether from junk food or alcohol, initial euphoria eventually gives way to a crash, and often self-loathing. The same is true for too much stimulus. Jacked up on tax cuts, a $1.3trn spending bill, easy monetary policy and a weakening dollar, the US economy has enjoyed its own version of a ‘sugar high,’ says JPMorgan. What’s worse, they warn: the crash is coming.
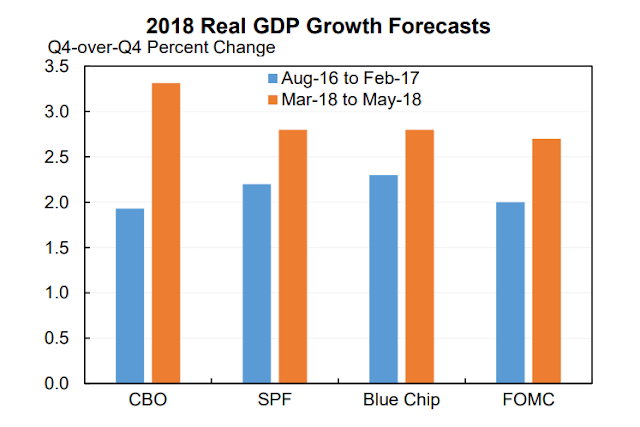
The chart below shows the evolution of 2018 real GDP growth forecasts from various well-respected sources, which has risen quite dramatically.
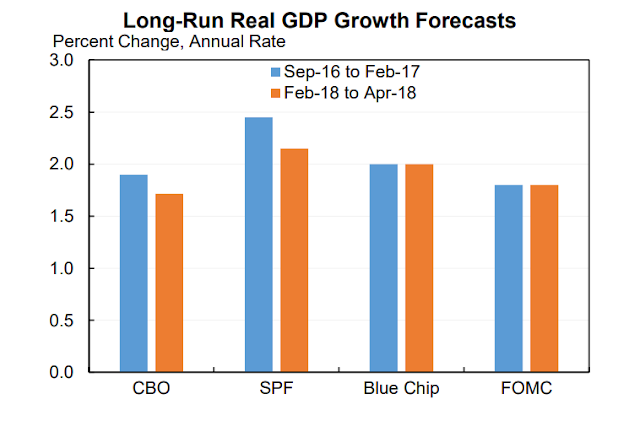
On the other hand, the same long-run growth forecasts from the same sources have been steady. Arguably, they have declined slightly.
The FT Alphaville post concluded:
For JPMorgan, US economic and earnings growth are bound to decline not just because of higher interest rates and a stronger dollar, but also because of the ongoing trade war, political tail risks in Washington and “the failure of the Fed to recognise those potential developments”.
Putting all together. If bond yields have been tracking real GDP growth in this economic cycle, and real GDP growth is likely to decelerate in the quarters ahead, then investors should expect downward pressure on bond yields (and upward pressure on bond prices) independent of the developments on inflation and inflationary expectations.
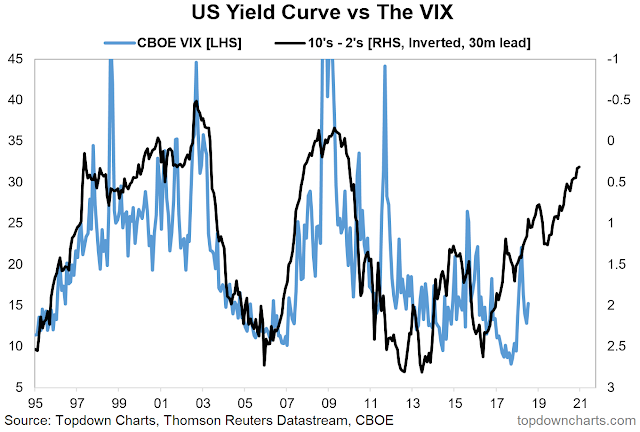
If I am correct in my analysis, then expect the yield curve to continue to flatten as the Fed continues to tighten monetary policy. For equity investors, this translates to greater volatility in the future. Analysis from Callum Thomas of Topdown Charts indicates that the shape of the yield curve leads equity volatility.
Get ready for a bumpy ride ahead.


There is a huge debt bubble that has been inflating for decades. It really got going after 1971 and the closing of the gold window. We have an aging population. Old people spend less. Maybe we will have deflation in spite of whatever the government and the Fed try. Like Japan has been stuck for years. If the real GDP is negative then bonds could have a low yield for a long time. After all, if the government is doing MMT to fund it’s entitlement programs, why pay high rates? This would encourage the quest for a new world reserve currency no doubt.
The two FRED graphs show a slowing of annual GDP growth since 1980s. We now have reached a recent term peak (2.5%) GDP growth. One could speculate a stall of GDP rise, with asset prices at historic highs. As rate of rise of GDP slows or stalls here, longer term bonds may rally. It is any ones guess if we hit a recession in the next neat future, Fed funds rate may go below zero, causing longer term bonds to rally hard. For folks creating bond ladders, perhaps, this is time to take a slice of your portfolio and buy longer term bonds (10-20 years). Any takers on this chain of thought?