Mid-week market update: There was a lot of skepticism in response to my last post (see How many pennies left in front of the steamroller?). Much of it was related to comments relating to positive market breadth.
I am in debt to Urban Carmel who pointed out back in May that the Advance-Decline Line tends to move coincidentally with the major market indices. Here is an updated five-year chart of the 52-week highs-lows, and the NYSE Advance-Decline Line. The peaks in both of these indicators have either been coincidental, or lagged the stock market peak.

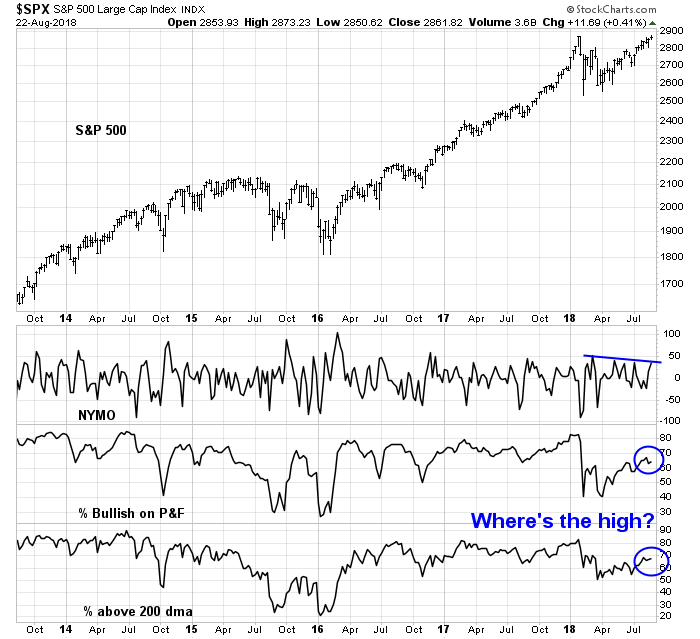
Other breadth indicators, on the other hand, have been less kind to the bull case. The chart below shows NYMO , or the NYSE McClellan Oscillator, % bullish, and % above the 200 dma. NYMO has been trending down even and exhibited a series of lower highs even as stock prices recovered. Both % bullish and % above 200 dma failed to confirm the recent test of the all-time high, as they failed to achieve new highs in the last month.
The market shrugged off the Manafort and Cohen news and closed roughly flat today, but the index flashed a bearish graveyard doji candle yesterday as it unsuccessfully tested its all-time highs while exhibiting a negative RSI-5 divergence.

In addition, the latest breadth readings from Index Indicators show that the market is retreating after reaching an overbought reading on a 3-5 day time horizon.

…and on a 1-2 week time horizon.

Regardless of whether you agree with me on my bearish intermediate term outlook, these conditions argue for a short-term pullback.
My inner trader remains short the market.
Disclosure: Long SPXU
Hmmm. I personally have a problem trying to pick a top at new highs. I’ve weighed the info in Cam’s recent posts and other data I watch and am having trouble deciding to go to cash. I can still see the market making a big move if Trump closes some favorable NAFTA deals.
That said. Here is an indicator from MarketWatch that has flashed sell signals only 5 times in the last 100+ years and is flashing one now.
https://www.marketwatch.com/story/the-stock-markets-latest-sell-signal-has-happened-only-5-other-times-since-1895-2018-08-21
@ Wallace,
Well, if you read the article, it says that, the indicator is sometimes off by 2 years before the top.
So in my mind, even if you disregard the long time that it takes for the top to happen as per that indicator, and if you are worried about losing too much, you don’t need to go all cash. You can go 50%:50% cash:investments. Will still catch the top if it happens in 2 years, just won’t make as much, or lose as much if the things go the other way.
With a record amount of money to be committed during the next few weeks of fiscal year 2018 by the US government (election period window dressing) it is undoubtedly going to show an economic uptick around the end of October. So a massive rally into year end is a reasonable assumption after a considerable pullback. I will play the uptrend and prepare for a second decline into 2020. This infusion of cash is known by the FED already and is driving interest rate policy. The public is always misled and it’s happening again.
The monthly chart of SPXU is displying abnorrmal volume:
https://photos.app.goo.gl/6wPCkDmG6JJbNezk6