A reader commented on the weekend, “TBH, being long here sure feels like picking up pennies in front of a steamroller”. I agree. While I have been steadfast in my belief of a “Last Hurrah rally” before a significant market top, that scenario is looking far less likely.
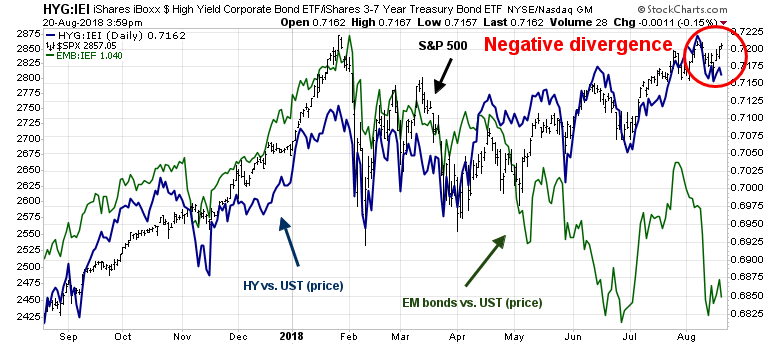
As the market tests a key resistance level, it is displaying both a negative RSI-5 divergence, which is tactically bearish, and faltering internals, which is intermediate term bearish.

There is a distinct possibility that we may be seeing a final market top in the major US equity indices this week. While the market may rally to new marginal highs, I believe that the risk/reward ratio is turning unfavorable for the bulls, and there may not be many pennies left on the road in front of the steamroller.
Risk appetite is deteriorating
Here are some of the worrisome signs that the bulls are losing control of the tape. The ratio of high beta to low volatility stocks breached a significant relative support level, indicating a significant deterioration of equity risk appetite.

In the credit market, the relative price performance of high yield (junk bonds) to their duration equivalent Treasuries is not confirming the recent equity rally. Needless to say, the relative performance of EM bonds has been terrible.
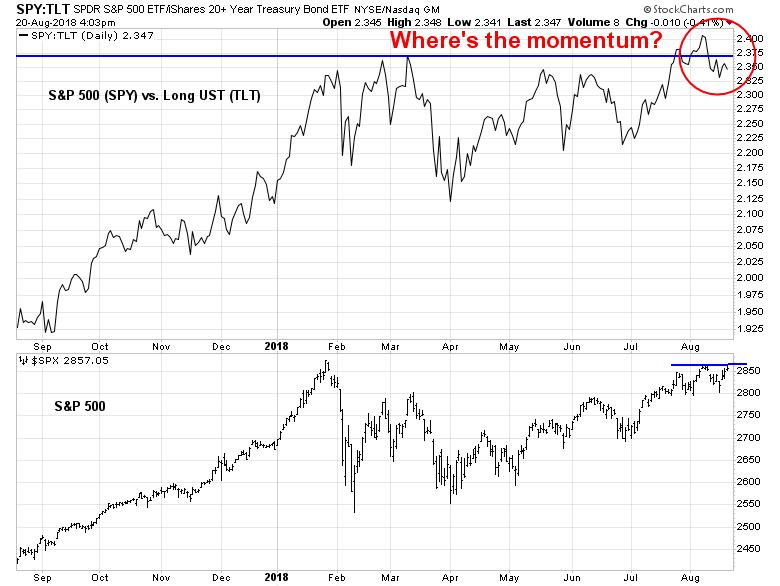
Equally disturbing is the inability of the SPY/TLT (stock/bond) total return ratio to rise after its upside breakout and pullback to test the relative resistance turned support level. This is another negative divergence that is bearish sign for risk appetite.
My inner investor has been opportunistically lightening up his equity exposure since my market warning two weeks ago (see Market top ahead: My inner investor turns cautious). My inner trader sold his long positions, and reversed to the short side today.
Disclosure: Long SPXU
Isn’t it possible that if the spx continued higher then it would erase the 5 day rsi divergence? Is it better to wait for the current rsi to turn down before concluding that there is a divergence and going short? thanks!
The RSI indicator is usually used in one of two ways to generate sell signals:
1) When it becomes overbought (>70) and turns down from an overbought reading. An RSI-5 sell signal already occurred on August 10.
2) When it experiences a negative divergence, where the underlying stock or index outperforms RSI. That is interpreted as a warning that the advance is unsustainable, which happened today.
thanks for the info!
Cam – looking at at the AD line making a new high and New Highs – New Lows best in weeks – internals look good – can this more a rotation out of high beta into more quality than market top? Thanks
Cam… If your are correct and the SPX goes into a multi month downturn; do you have any thoughts where longer term $ will flow to.
Cam
Earnings yield on S&P 500 170/2900=5.8%) is double that of the ten year treasury (3%). Historically, the ratio is 1 to 1. This ratio should favor stocks.
The US Federal reserve has discussed raising capital using longer term bonds (10 year or so), which would be bearish for the longer term bond market. That would be seen as a sign of confidence, in the US, not weakness and cause the yield curve to steepen.
You have alluded to how inversion of yield curve this time may not have the same significance (in the short term at least), as it has had traditionally.
Consumer America’s balance sheet remains rock solid.
Housing excesses have been squeezed out. As a result, Americans will need to save more, if they want to buy houses (getting subsidized housing loans in unique to America). As a result, America is approaching conventional housing ownership model that exists in overseas markets (i.e. using less government subsidies, using more cash from savings), that explains a subpar performance of the housing market. Housing formation still continues and young people are still going to need housing.
Yes, stock market is not cheap but closer to historic averages. Stock buy backs continue, as does capital repatriation (hence Mr. Buffett is buying Apple by the boat loads).
Facebook, Netflix, Nvidia have rolled over but market has not rolled over because of change of leadership, which is how bull markets traditionally unfold.
On a longer time frame we had a secular bull market from 1982-2000, that lead to a decade long bear market (2000-2010 give or take). Historically, one could argue that we could be in the early stages of a secular bull market (1929-37 comparisons with the current market, not withstanding). Yes, the GFC in some ways, was an anomaly that was corrected (see Tier 1 capital ratios of US banks are pretty good), albeit with some difficulty.
I remain puzzled by your call to reduce long term portfolio positions. It may be entirely possible that your call is highly personalized to your own portfolio situation, and not generally applicable to a wider audience.
Please re-read what I wrote 2 weeks ago: https://humblestudentofthemarkets.com/2018/08/05/major-top-ahead-my-inner-investor-turns-cautious/