Mid-week market update: The fate of this market is becoming highly news dependent. Ed Yardeni recently stated in on CNBC that he has never seen a “president this bullish and bearish at the same time”. The market wants to go up on earnings, but it has been held back by Trump`s protectionism.
Will stock prices rise or fall? Is the trade war correction over?
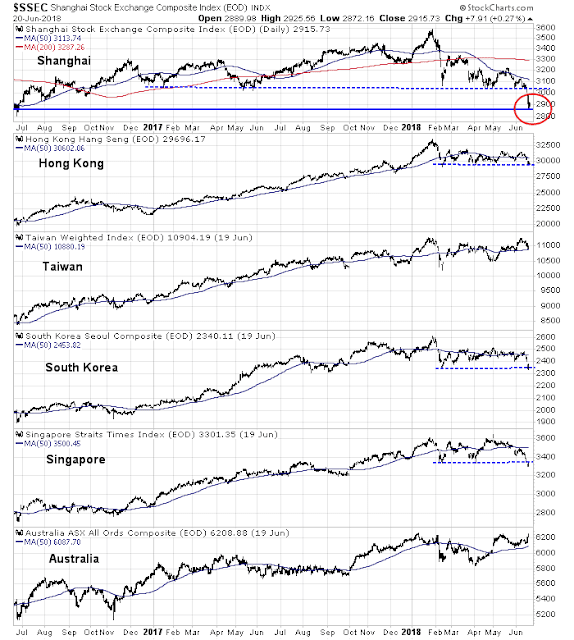
Unfortunately, my time machine is in the shop getting fixed. However, we can rely on technical and sentiment analysis to give us some clues. First and most encouraging was the market price action overnight. The Shanghai market stabilized and showed a minor gain after the horrendous drop Tuesday. The stock markets of China’s major Asian trading partners also showed signs of recovery, and the markets in Hong Kong, South Korea, and Singapore successfully tested key support levels.
In addition, I had highlighted a technical pattern on June 10, 2018 (see Can America still lead the world?) indicating that the market had broken down out of a series of bearish wedges. Each breakdown was accompanied by either the VIX breaching or touching its lower Bollinger Band. Subsequent corrections have lasted roughly two weeks, and each pullback have been increasingly shallow, which is intermediate term bullish.
If history is any guide, and notwithstanding more trade war jitters, the market’s weakness should end this week. Tactically, it is less clear whether we have seen the actual bottom of this correction just yet.
Not enough fear
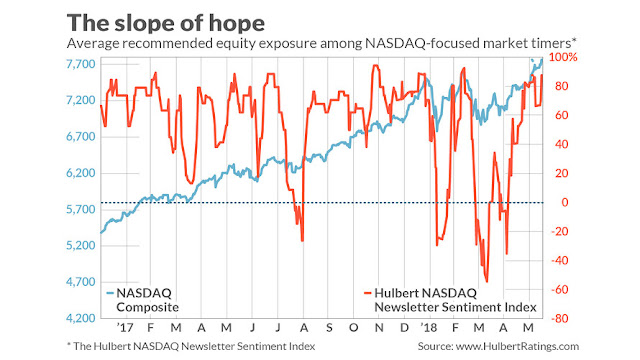
However, my sentiment models suggest that fear hasn’t spike sufficiently for a durable bottom. Mark Hulbert wrote this week’s market weakness may not just attributable to the Sino-American trade spat, but excessively bullish sentiment among NASDAQ market timers. His Hulbert Nasdaq Newsletter Sentiment Index (HNNSI) reached an extreme bullish reading. In other words, sentiment had reached a crowded long, and the news of the trade friction was just the spark for the sell-off.
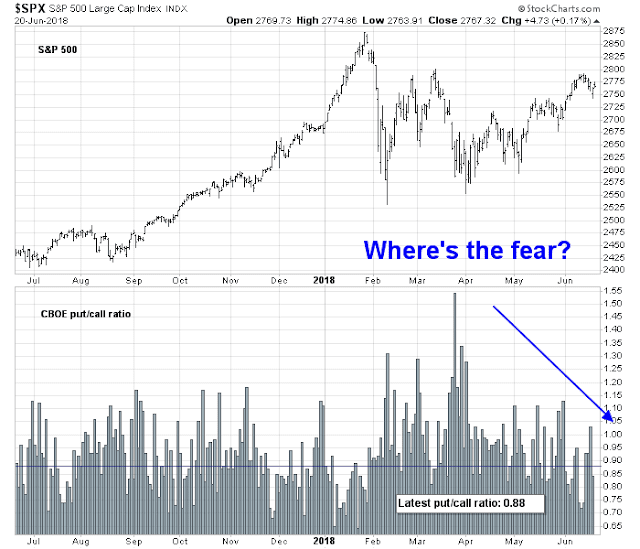
Other sentiment indicators are also showing signs of complacency. The latest CBOE put/call ratio stands at 0.88, which can hardly be interpreted as a high level of fear.
The option market is also relatively sanguine about this week’s pullback. Neither the VIX Index is anywhere near its upper Bollinger Band, nor is the term structure of the VIX inverted. While neither of these signals need to be triggered for me to generate a trading buy signal, indications of spiking fear would supportive signs of a trading bottom.
Stock prices are also facing a seasonal headwind this week. Rob Hanna at Quantifiable Edges found that the week after June OpEx has been weak. On average, stock prices have historically fallen steadily during the week, except for a reflex rally on Wednesday.
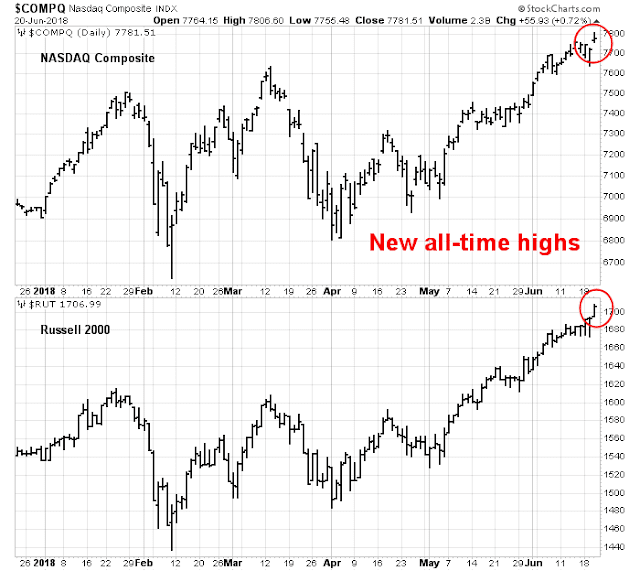
In conclusion, the markets appear to be trying to bottom here, but the shape of the bottom is more likely to be a W rather than a V. Nevertheless, the intermediate term outlook remains bullish. The market leaders, the NASDAQ and small cap stocks, made fresh all-time highs today. It is difficult to interpret such developments as anything but bullish.
Subscribers received an email alert yesterday (Tuesday) that I was ready to cover my short position and go long if the SPX tested its support at 2735-2740. It never reached that level, and therefore my inner trader remains short in anticipation of a retest of Tuesday`s lows in the next few days.
Disclosure: Long SPXU


Cam
In the futures markets, ES (S&P 500) had a low of 2735.5 on Tuesday night. That completes the test of your 2735-2740 range.
I agree with your conclusion, “The market leaders, the NASDAQ and small cap stocks, made fresh all-time highs today. It is difficult to interpret such developments as anything but bullish.”
However, direction may not be resolved until a breakout of the 19-wk symmetrical traingle. One good approach is to only buy when price drops into a support zone. then keep tight stops.
https://pbs.twimg.com/media/DgCqsJGX0AIfac-.jpg:small