Preface: Explaining our market timing models
We maintain several market timing models, each with differing time horizons. The “Ultimate Market Timing Model” is a long-term market timing model based on the research outlined in our post, Building the ultimate market timing model. This model tends to generate only a handful of signals each decade.
The Trend Model is an asset allocation model which applies trend following principles based on the inputs of global stock and commodity price. This model has a shorter time horizon and tends to turn over about 4-6 times a year. In essence, it seeks to answer the question, “Is the trend in the global economy expansion (bullish) or contraction (bearish)?”
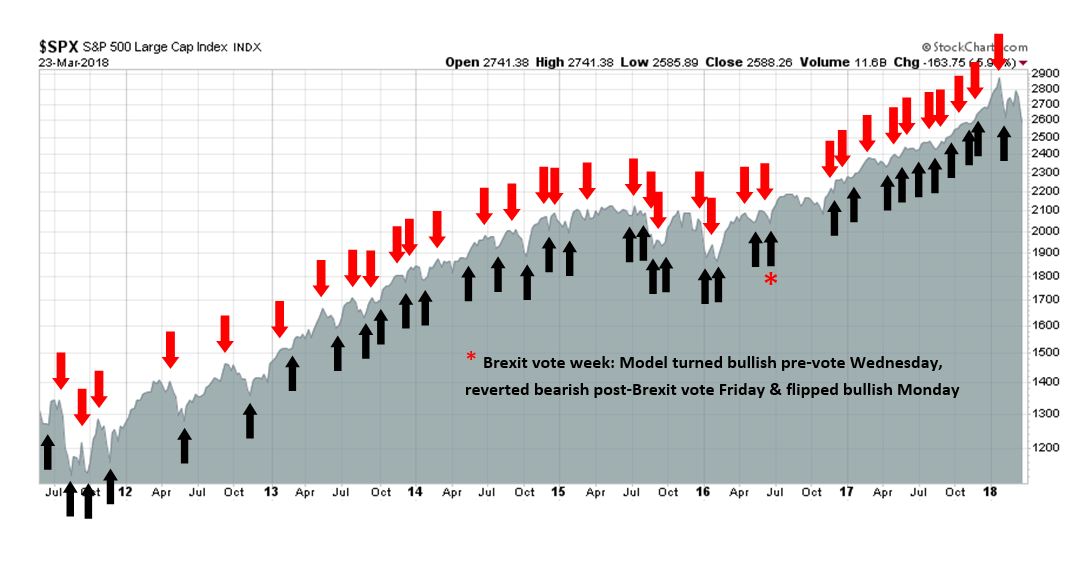
My inner trader uses the trading component of the Trend Model to look for changes in the direction of the main Trend Model signal. A bullish Trend Model signal that gets less bullish is a trading “sell” signal. Conversely, a bearish Trend Model signal that gets less bearish is a trading “buy” signal. The history of actual out-of-sample (not backtested) signals of the trading model are shown by the arrows in the chart below. The turnover rate of the trading model is high, and it has varied between 150% to 200% per month.
Subscribers receive real-time alerts of model changes, and a hypothetical trading record of the those email alerts are updated weekly here.
The latest signals of each model are as follows:
- Ultimate market timing model: Buy equities
- Trend Model signal: Neutral (downgrade)
- Trading model: Bullish
Update schedule: I generally update model readings on my site on weekends and tweet mid-week observations at @humblestudent. Subscribers receive real-time alerts of trading model changes, and a hypothetical trading record of the those email alerts is shown here.
A market triple whammy
Last week, the stock market was hit with a triple whammy of bad news.
- Negative stories about market and momentum leader Facebook (FB);
- A moderately more hawkish message from the Federal Reserve; and
- The prospect of a trade war that could tank the global economy.
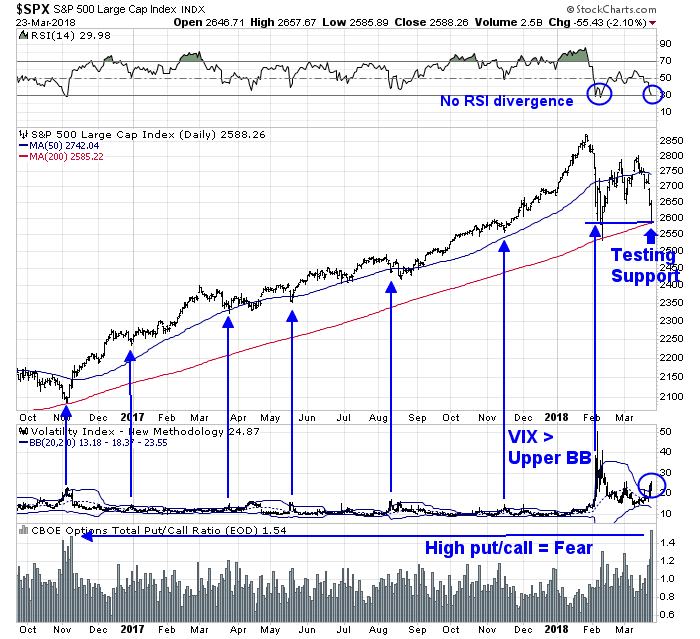
As a result, the SPX fell -6.0% for the week. The market is obviously stretched to the downside. The SPX is testing support at its February lows and the 200 day moving average (dma). The VIX Index has risen above its upper Bollinger Band, which is a short-term oversold signal. As well, the CBOE put/call ratio spiked to high levels indicating fear.
Is this enough to signal a short-term bottom? This week, I address the dual macro threats of Fed policy, and the possible effects of a trade war. There are many others who can much analyze FB better than me, and stock specific analysis is outside my scope.
A dovish hike?
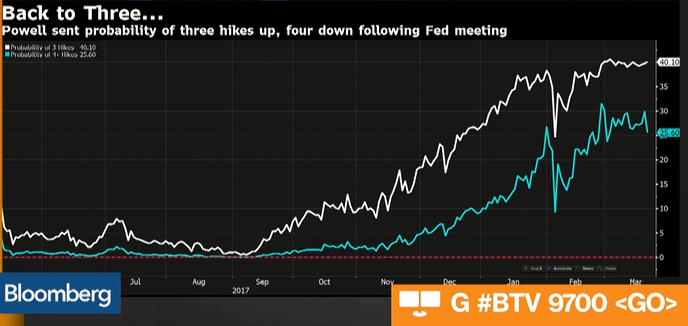
The dot plots released by the Fed after last week’s FOMC meeting revealed a slightly more hawkish monetary policy outlook. While the 2018 median funds rate projection was unchanged, the mean for 2018, and the medians and means for 2019 and 2020 were raised. Nevertheless, it was interpreted by the markets as neutral to slightly more dovish than expectations. The white line in the chart below depicts the probability of three rate hikes in 2018, and the blue line the probability of four hikes. The probability of four rate hikes dropped to the bottom of its recent range after the FOMC meeting and Powell press conference.
Fed watcher Tim Duy interpreted the Fed statements as dovish because Powell stated that the 2% inflation target is symmetrical, and 2% is not a ceiling.
This persistent period of low unemployment feeds into the Fed’s forecast and comes out as faster inflation. The projections now show that central bankers expect inflation to surpass the target, rising to a high of 2.1 percent at the end of 2019.
In other words, the Fed is explicitly forecasting overshooting the inflation target. Policy makers could crank up the interest-rate forecast to eliminate that overshooting but instead have chosen a less aggressive policy path.
If Fed officials were determined to avoid an overshoot, they would need to act more aggressively to push unemployment up toward their estimate of the natural rate. That is a big move in this forecast, a 0.4 percentage point jump from where the rate stands today, and 0.9 percentage point higher than the 2019 forecast.
The Fed, however, has not proven able to nudge up the unemployment rate as much as would be required in this case without causing a recession. Hence, this forecast indicates the central bank is now at the point where policy makers don’t believe they could offset higher inflation without triggering a recession.
It remains to be seen how successful the Powell Fed will be in eventually raising the unemployment rate without triggering a recession. The Fed has been largely unsuccessful in such efforts in the past.
I interpret the Fed’s reaction function as dovish. In light of late stage expansionary phase of the economy, and undergoing an unusual program of fiscal stimulus, the Powell Fed is acting in an extraordinarily cautious fashion.
Trade war fears: Bark or bite?
The other major threat to the market is the risk of a major trade war. I refer readers to analysis written in January that outlined the possible scenarios (see Could a Trump trade war spark a bear market?). The headlines certainly appear to be ominous. Trump announced that he has instructed US Trade Representative (USTR) Robert Lightizer to impose about $50 billion in tariffs on Chinese imports, according to this USTR factsheet. The USTR will have 15 days to come up with a proposed list of products, and there will be a 30 day comment period before the tariffs are actually imposed.
CNBC reported that China has responded with tariffs on $3 billion of US exports on a targeted list of 128 products.
China’s commerce ministry proposed a list of 128 U.S. products as potential retaliation targets, according to a statement on its website posted Friday morning.
The U.S. goods, which had an import value of $3 billion in 2017, include wine, fresh fruit, dried fruit and nuts, steel pipes, modified ethanol, and ginseng, the ministry said. Those products could see a 15 percent duty, while a 25 percent tariff could be imposed on U.S. pork and recycled aluminium goods, according to the statement.
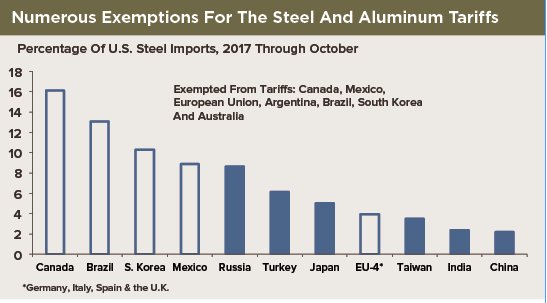
Take a deep breath. Firstly, the Chinese reaction has been surprisingly light, which is a signal that they are prepared to negotiate. The Trump administration’s actions on trade have so far been more bark than bite. Remember the steel and aluminum tariffs that were unveiled with great fanfare? Here is the latest list of countries given exemptions.
What about the threat to tear up the terribly “unfair” NAFTA trade pact? The Financial Post reported last week that there seems to be some progress based on some concessions from the American side on the issue of American content in auto production:
Canada’s ambassador to the U.S., David MacNaughton, suggested his newfound optimism was based on two developments in recent days: progress on the top U.S. priority of auto-parts rules, as well as a more general thawing of the frosty tone in earlier talks.
This comes as the United States appears increasingly keen on securing a quick agreement, with an upcoming round in Washington expected to feature a final push to obtain a deal before election campaigns in Mexico and in the U.S. Congress punt the process into 2019.
MacNaughton said the most recent American proposals could help the U.S. achieve its goal of safeguarding auto production there, potentially without a strict American-made content requirement in every car, an idea that has been a source of friction with Canada and Mexico.
He cautioned that the autos impasse isn’t completely sorted out yet.
“They came back with some ideas that if you take them to their logical conclusion would mean that you wouldn’t need that (American content) requirement,” MacNaughton told reporters after speaking at a Washington gathering of the American Association of Port Authorities.
“They put some interesting ideas on the table … which were actually quite creative. To which we sort of said, ‘Yeah, we can work with that.’… Did we get to somewhere where you could shake hands and say, ‘We’ve got a deal?’ Absolutely not… Whether or not we can get there I don’t know. But I took it as being a positive thing that they had another way of getting at that issue.”
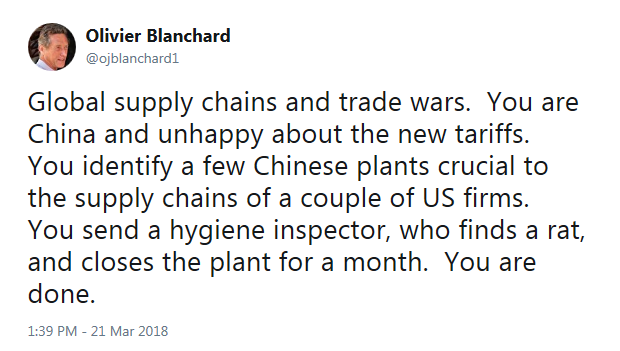
In addition, there are a number of indirect ways to pressure the White House without directly resorting to additional tariffs. Former IMF chief economist Olivier Blanchard had one simple suggestion.
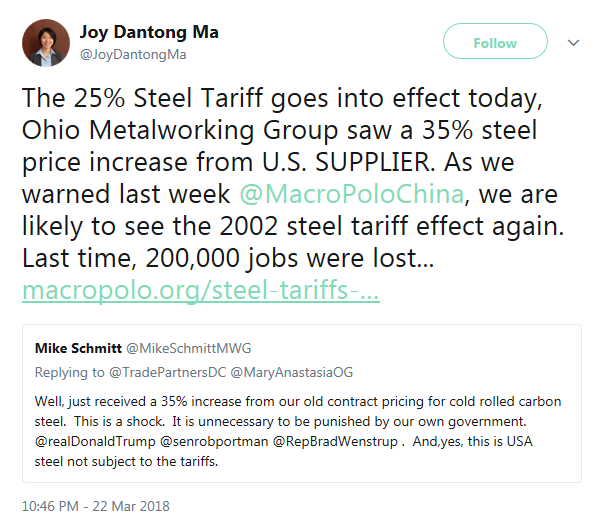
Here is another. Steel prices jumped by 35% from an American supplier.
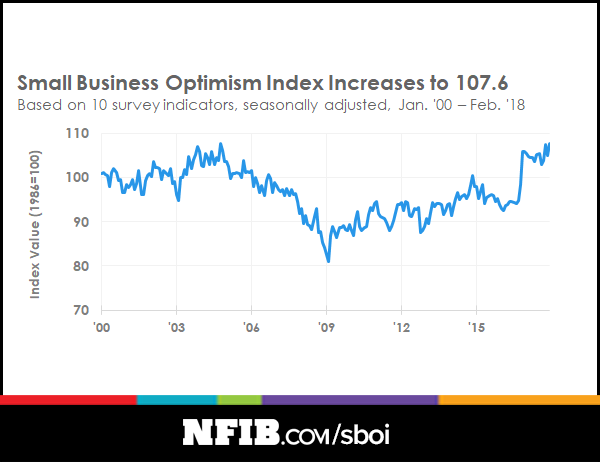
Minneapolis Fed president Neel Kashkari stated in a Bloomberg interview that the biggest trade war risk is an erosion of confidence. Small business owners form a disproportionately large percentage of Trump’s voter base. How long before NFIB small business confidence falls on account of these tariffs?
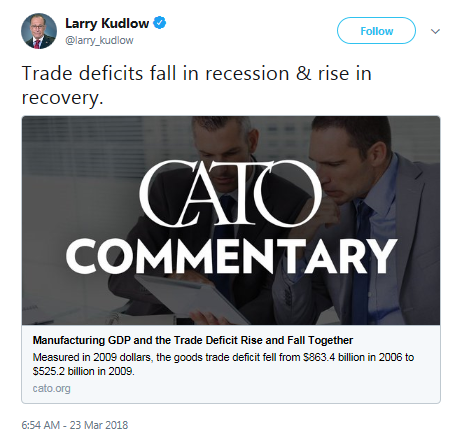
There is resistance within the Republican Party. Already, Larry Kudlow is trolling his new soon-to-be boss. Trade deficits are a sign of economic strength, not weakness.
In short, the political pressure on the White House will be tremendous. It will come from all quarters, such as the Republican Party, and from small and large businesses that form Trump’s electoral base. As we approach the midterm election, don’t be surprised if the following implausible scenario starts circulating around the Beltway as another way of putting pressure on the Trump administration:
- Tariffs start to hurt the economy and erode business confidence
- The election turns on a referendum on Trump’s economic policies
- Republican support tanks, and the Democrats win control of both the House and Senate
- Mueller returns a recommendation to indict Trump
- The House impeaches Trump, the Senate follows suit
- Pence is sidelined (as he was involved in some of the meetings)
- The speaker of the House is the next in line. Hello, President Pelosi.
The market is staring into the dark abyss and worst case scenario of a full-blown trade war. Don’t be so sure of such an Apocalyptic outcome.
Market nowcast still bullish
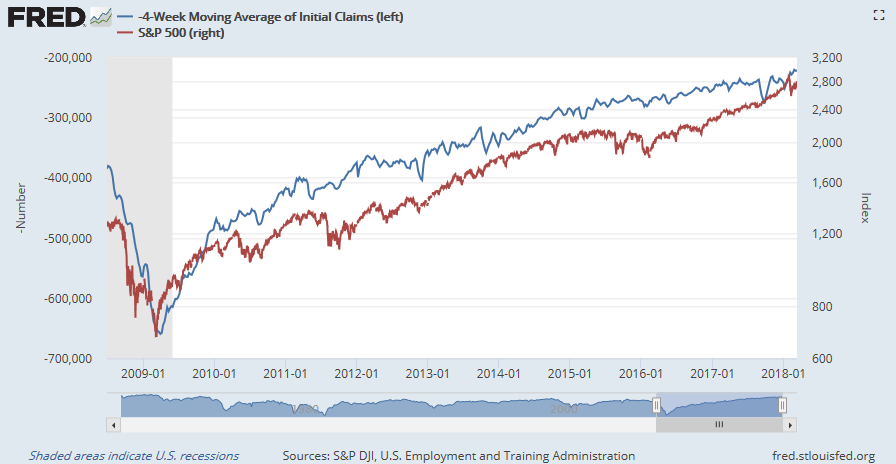
In the absence of these macro risks, the nowcast outlook for stock prices are still positive. Initial jobless claims have shown a remarkable inverse correlation to stock prices during this expansion, and initial claims continue to improve.
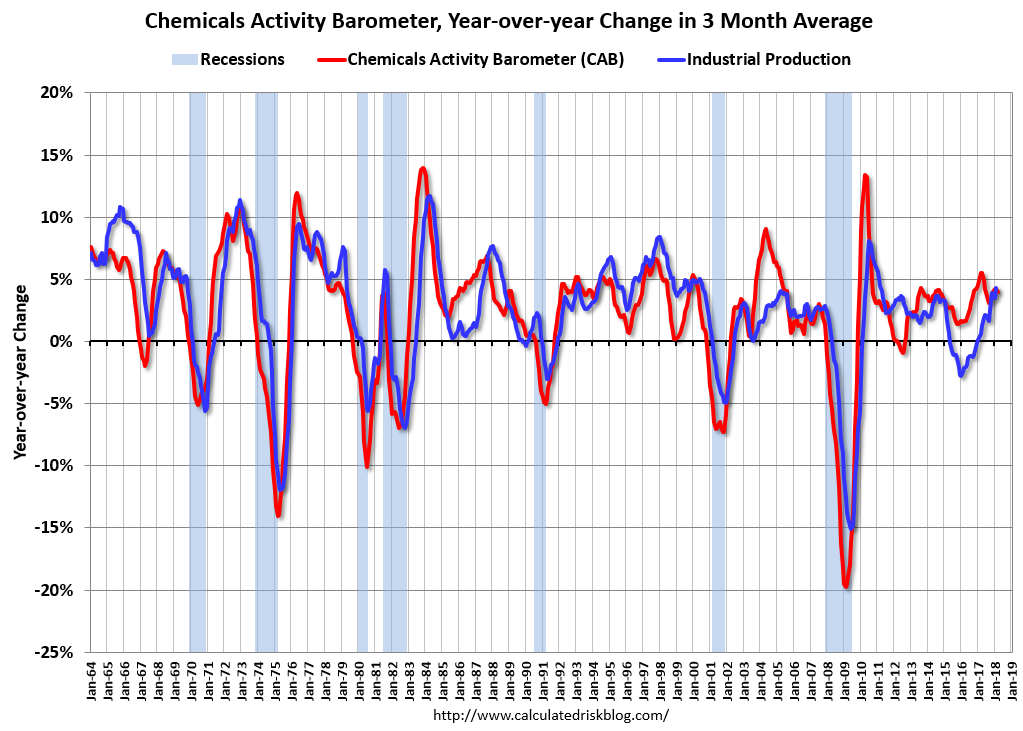
Calculated Risk reported that the Chemical Activity Barometer, which leads industrial production, is still rising.
Barron’s report of insider activity shows that this group of “smart investors” have been taking advantage of the current bout of stock market weakness to buy. While individual readings can be noisy and volatile, the pattern of consistent buying over the last few weeks is a vote of confidence in the stock market.
In effect, a bet on the market falling significantly from these levels is a tail-risk bet on a full-blown trade war.
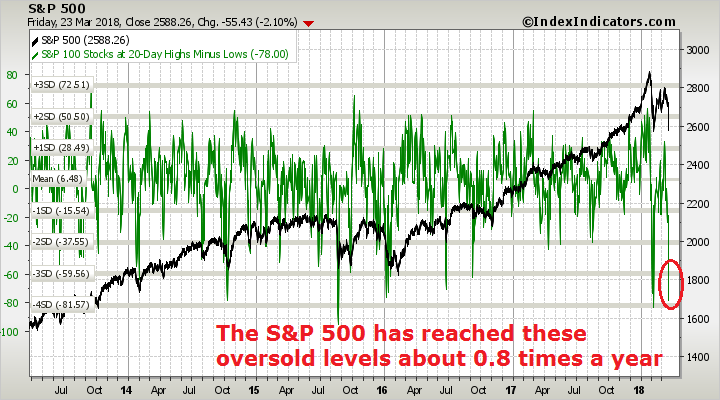
How oversold is the market?
When the SPX falls -6.0% in a single week, it is no surprise to call it oversold. That said, oversold markets can become more oversold. How oversold is this market?
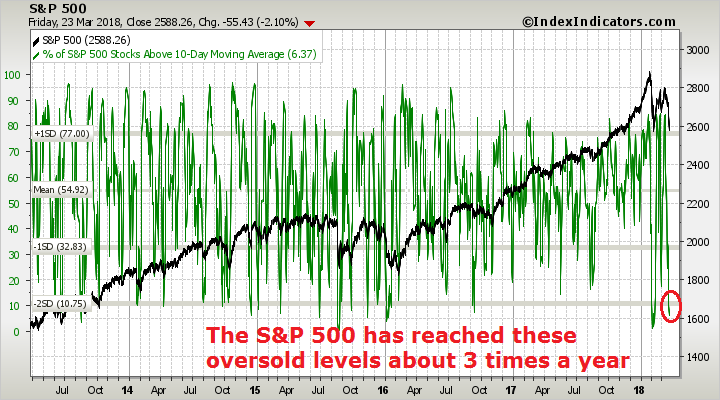
This breadth chart from Index Indicators show that it is oversold on a short-term (3-5 day) horizon. It has reached these oversold levels about three times a year in the last five years.
On a longer term (1-2 week) time horizon, the market has reached these oversold levels just under once a year in the last five years.
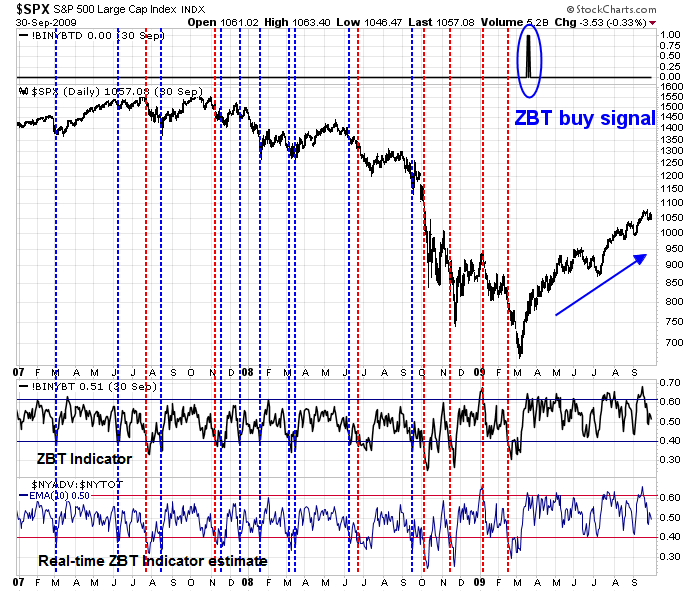
For another perspective, the market decline has created an oversold setup for a Zweig Breadth Thrust. While the oversold setups are relatively common, the actual ZBT buy signal, which occurs when the market rises on strong breadth after an oversold condition within a short period, is very rare. The middle panel of the chart below depicts the actual ZBT indicator signals. As the timing of that signal is delayed, the bottom panel shows the real-time estimate of the ZBT Indicator. As of Friday’s close, a ZBT indicator oversold setup has formed.

Here is a chart of the ZBT oversold conditions during the 2007-09 period. The blue vertical lines show the instances where the market became oversold according to this indicator and experienced a short-term rally afterwards. The red vertical lines show the instances where the oversold signal failed and the market continued to fall. The lessons from this period in history tells us about how oversold markets can become more oversold. It was mostly during the steep declines and terminal phases of the bear market when these oversold conditions failed as buy signals.
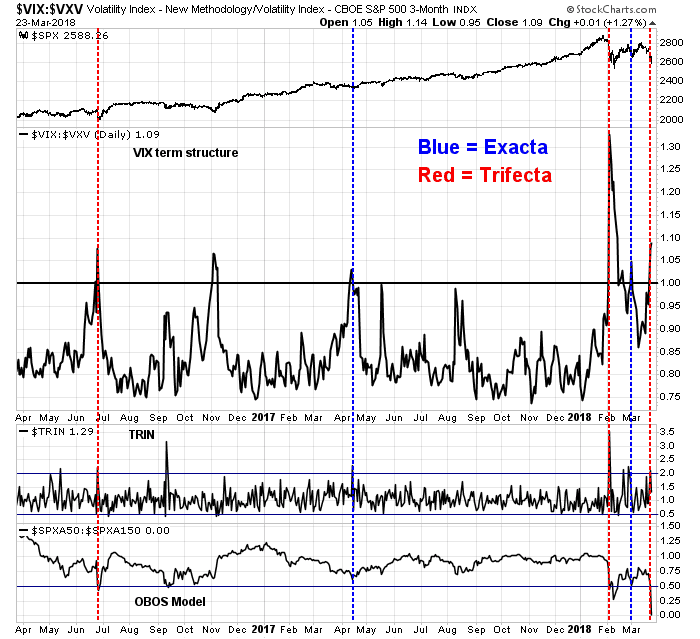
My Trifecta Bottom Spotting Model also flashed a buy signal as of the close last Thursday. While the signal was early, it was nevertheless an indication of a deeply oversold market that is due for a bounce.
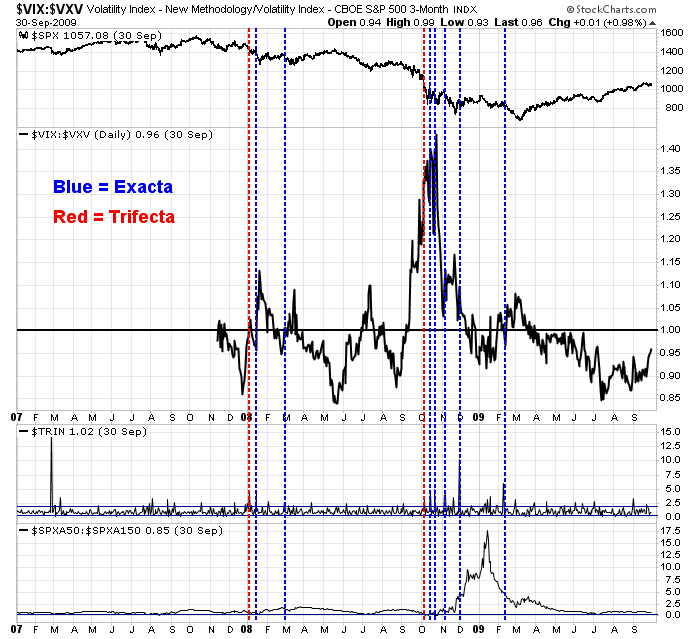
Here is the track record of this model during the 2007-09 period. The term structure of the VIX Index was unavailable for much of 2007, and therefore we will have to make do with analyzing the performance of this model for 2008-09. This OBOS component of this model (bottom panel) went a little haywire because of the nature of the 50 and 150 day moving averages. Nevertheless, we can observe that the behavior of this model was similar to the ZBT oversold indicator. It did not perform well during the cascading bearish period when the oversold market became more oversold.
In essence, a bet on oversold mean reversion today is a bet that this is not the start of a major bear market. How likely is that?
The preconditions of a bear market
In my view, these are the preconditions of a bear market:
- A high likelihood of a recession in 12 months
- An exogenous event, such as a trade war
- Technical deterioration
As I discussed in last week’s post (see When the story changes…), the likelihood of a recession remains low. New Deal democrat’s always useful review of high frequency economic indicators tell the story. As the stock market tends to focus mainly on the short leading indicator, their positive outlook is supportive of higher equity prices over the next few months.
The short term forecast is very positive, as corroborated by the recently very strong index of Leading Indicators, although gas and oil prices bear closer watching. The nowcast is also positive, despite weakening in several components.
While a full-blown trade war is always possible, I have already pointed out that there are powerful obstacles in the way of a conflict, and the short history of the Trump administration on trade has been more bark than bite.
Finally, the history of past major bear markets has been preceded by signs of technical deterioration. Even as the SPX tests support at its February lows, there are no signs of negative breadth divergences and a few signs of positive divergences.
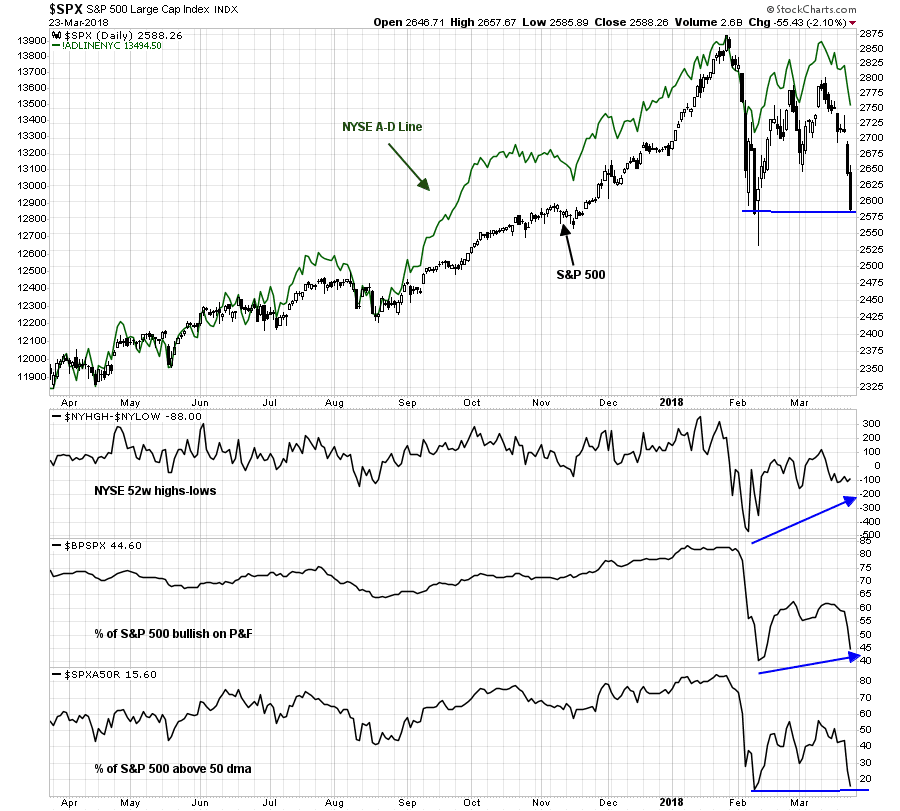
If the market were to make a major top at these levels, a more likely scenario would see a rally from current levels to test or exceed the old highs while internals exhibit signs of negative divergence. That hasn’t happened yet.
A Monday flush?
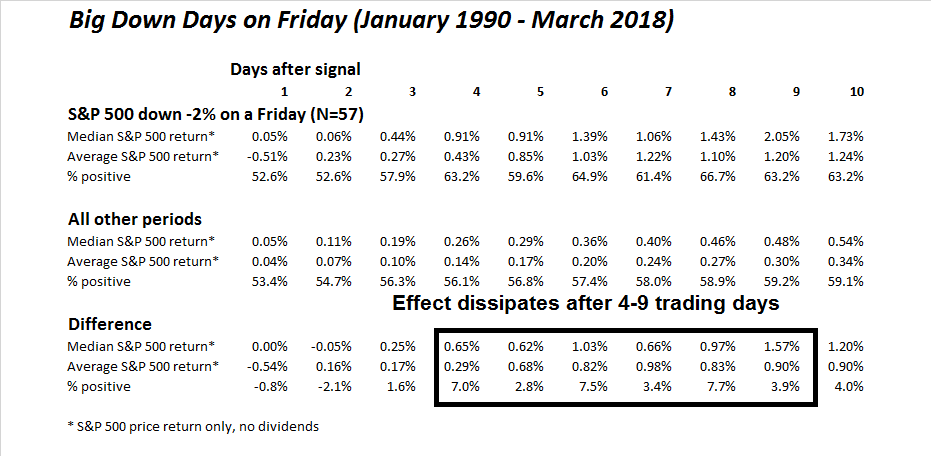
Looking to the week ahead, there have been some scary analysis circulating on the internet about what happens after a big Friday decline.
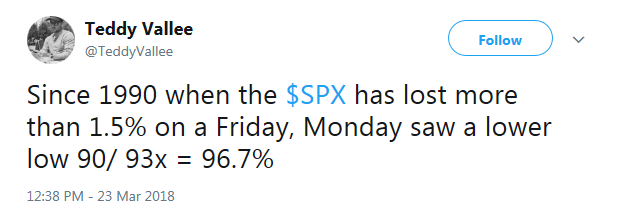
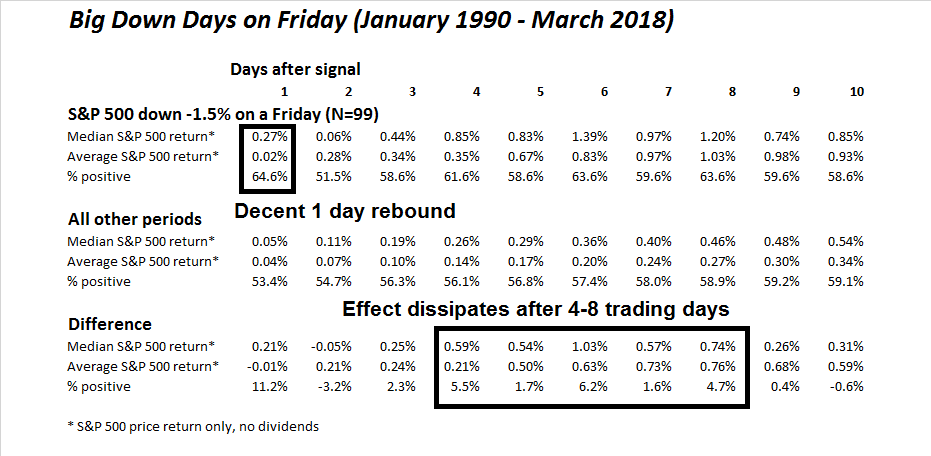
It is not my normal practice to engage in this kind of analysis as it borders on torturing the data until it talks. However, my own study using the same time frame shows that the market had a decent one-day rebound, and the rebound effect dissipated after 4-8 trading days. (Data and spreadsheet available upon request in the interest of full transparency).
Since we are torturing the data, let’s see what happens with a -2.0% down day on Fridays.
Here is the same analysis, based on -1.5% down days on consecutive Thursdays and Fridays. The sample size falls dramatically (N=15).
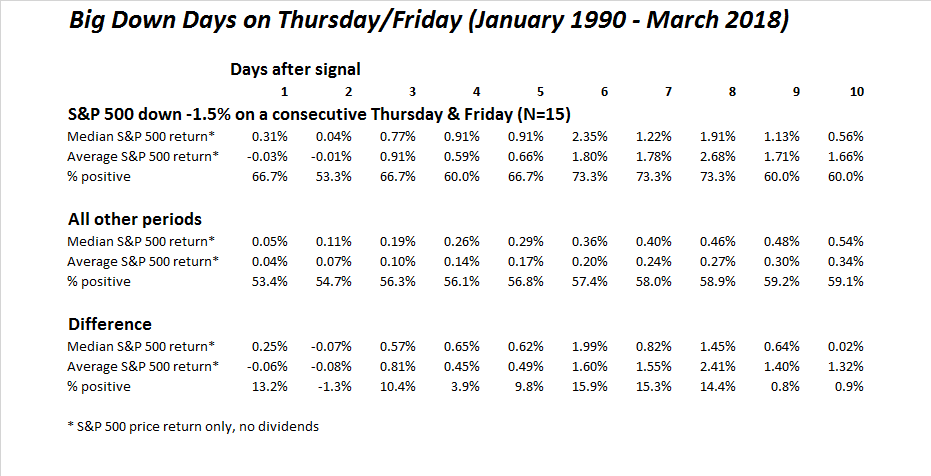
Bottom line: There is no truth to the myth of Friday weakness inevitably leads to a Monday sell-off.
My inner investor remains constructive on stocks. My inner trader was caught long, but he believes that the risk/reward favors the long the bulls in the short-term.
Disclosure: Long SPXL
What is your probability that the market top for this cycle has been made?
There was an important difference in this week’s decline from the Jan-Feb one;. Gold and long term bonds went up sharply this time. Last time they tumbled with stock markets. This tell me the first mini crash was a ‘flash crash’ but this latest has an economic basis. The controversial new US trade policies and the hawkish tone of the new Fed chief are a real problem that could lead to a bear market.
The continued escalation of the VIX is another bad sign.
If we are experiencing a market turning point to a new bear market, markets will hit a series of oversold readings with rather weak upswings in between. This is unlike a bull market where pullbacks are quick and shallow with strong upswings that last several months and produce strong overbought highs.
Also, the parabolic upswing to the January high with extreme investor optimistic sentiment has me more cautious than normal in it’s aftermath.
When the EMA200 levels out before showing negative momentum the market is past its prime and down:
2000 ~-5.5%
2008 ~-5.8%
Currently ~-11%
(Confirm)
Hi Cam,
Do you have any thoughts on LIBOR-OIS spread? Will it rattle treasury yields and stocks? LIBOR rates are used as reference for mortgages and corporate loans and I don’t know what to make of it.
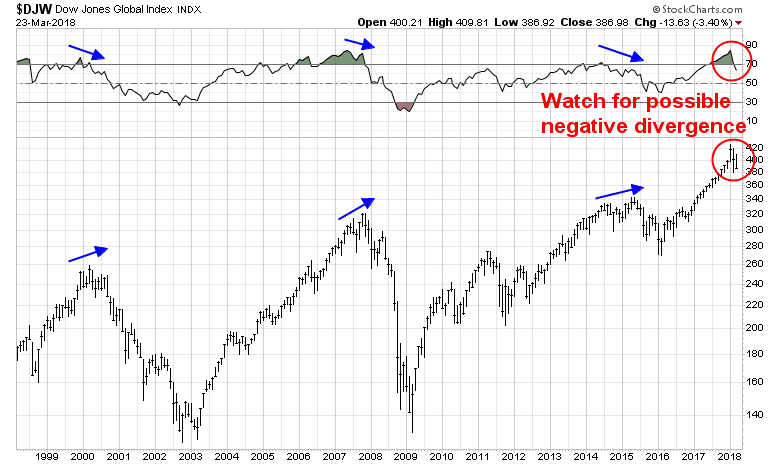
And regarding the $DJW chart with the comment “Watch for possible negative divergence”: do you think the RSI that peaked in early 2018 is too high to surpass given current sentiment and political uncertainty? This would mean negative divergence unless the market rallies sharply.
Thanks.
Hard to tell. Big test this week as there is a flood of T-Bill issuance.
FWIW, BIS issued an extensive analysis of USD funding: https://www.bis.org/publ/work708.htm
The bears seem to have taken control since Thursday, when the IHS Markit Flash PMI surveys were released in the morning.
For the US:
https://www.markiteconomics.com/Survey/PressRelease.mvc/6ffb310496f0448a9a25f7bcca8aa74e
Quote:
The flash PMI surveys indicate that the economy likely continued to expand at a robust pace in March, rounding off a solid opening quarter of the year. The surveys are running at a level consistent with annualised first quarter GDP growth approaching 2.5% (though we note that official GDP estimates may once again understate growth in the opening quarter of the year).
…
Inflationary pressures meanwhile remain a key theme of the surveys, especially in manufacturing, reflecting increased raw material prices, notably for metals. The survey found average prices charged for goods and services are rising at one of the strongest rates seen since 2014. Furthermore, with factory costs showing the largest jump for seven years amid growing shortages of key inputs, inflationary pressures appear to be on the rise.
It might also be of note that European markets closed in the red today, this was the release for the Eurozone:
https://www.markiteconomics.com/Survey/PressRelease.mvc/26cfb9d0889f4e398cfb3b73c42242e2
Quote:
The data therefore suggest that eurozone growth peaked around the turn of the year and the region is settling into a slower, but still robust pace of expansion. Price pressures have meanwhile also eased slightly, in part linked to cheaper imports arising from the euro’s recent strength, but remain elevated.
Short positions on European shares have also increased.
Has global synchronized growth peaked?