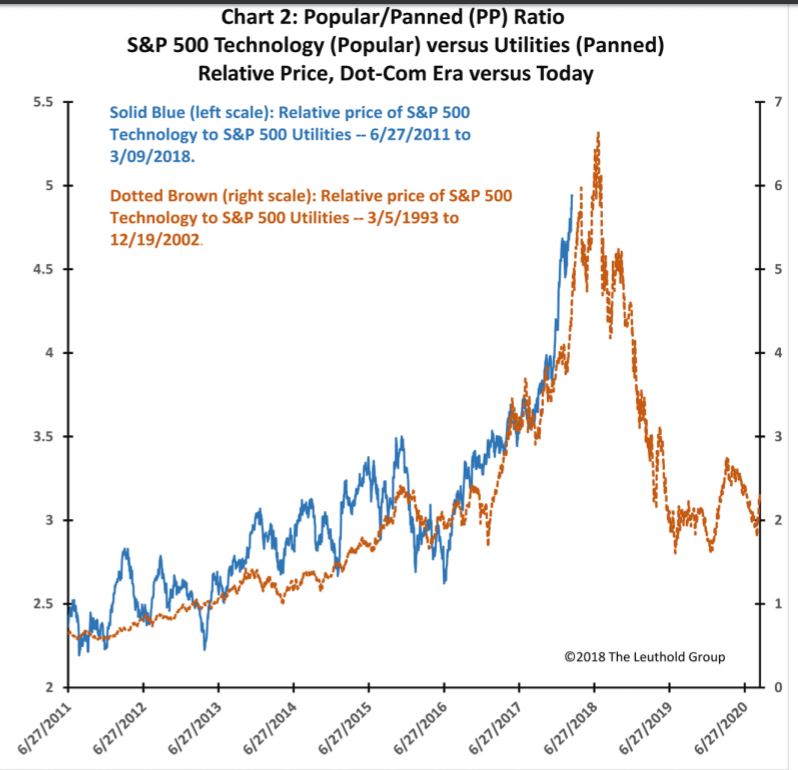
Mid-week market update: There have been a number of questions of whether the NASDAQ run is over. Marketwatch reported that Jim Paulsen of Leuthold Group highlighted the vulnerable nature of technology stocks. Paulsen pointed to the Tech/Utilities ratio as a way of showing that Tech is nearly as stretch as it was during the height of the NASDAQ bubble.
Chris Kimble also worried about the recent NASDAQ breakout, which was not followed by the major large cap averages, as well as a negative RSI divergence.

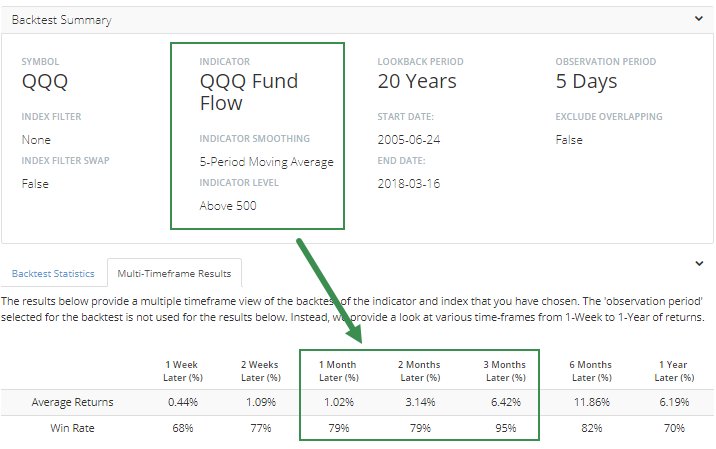
In addition, Kimble highlighted the huge weekly inflow into the NASDAQ 100 ETF (NDX), which could be interpreted as contrarian bearish.

If the NASDAQ falters, what would a loss of Tech leadership mean for overall stock prices?
Don`t panic
Traders should relax. Firstly, analysis from SentimenTrader showed that large inflows are not contrarian bearish.
Even if you thought that the large inflows was bearish, excitable traders withdrew nearly $13B from equity ETFs and $2B from NDX on Monday in the wake of the Facebook news. Is that contrarian bullish and a sign of incipient capitulation?

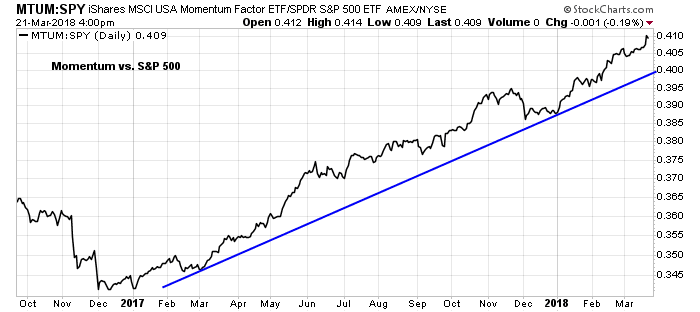
The market melt-up that began in late 2017 was powered by price momentum. The latest update of the momentum factor (MTUM/SPY ratio) shows that price momentum remains healthy.
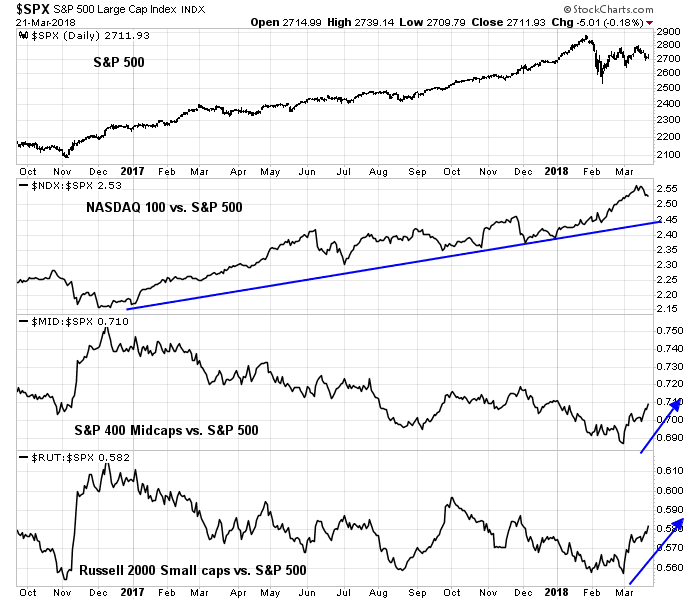
The analysis of relative performance shows that NASDAQ 100 stocks remain in a relative uptrend. Even if it were to falter, the leadership baton could be taken up by mid and small cap stocks. Don’t despair just yet.
One last flush?
While the intermediate term outlook remains bullish, the short-term is cloudy. Investment News reported that a Bankrate.com survey revealed a lack of panic among individual investors during the February correction;
Just 6% of individual investors were net sellers during the February correction, according to a survey of 1,063 adults with investment accounts conducted by Bankrate.com. Another 15% added to their investments, while 60% intentionally did nothing. (Sixteen percent were unaware of the sell-off altogether.)
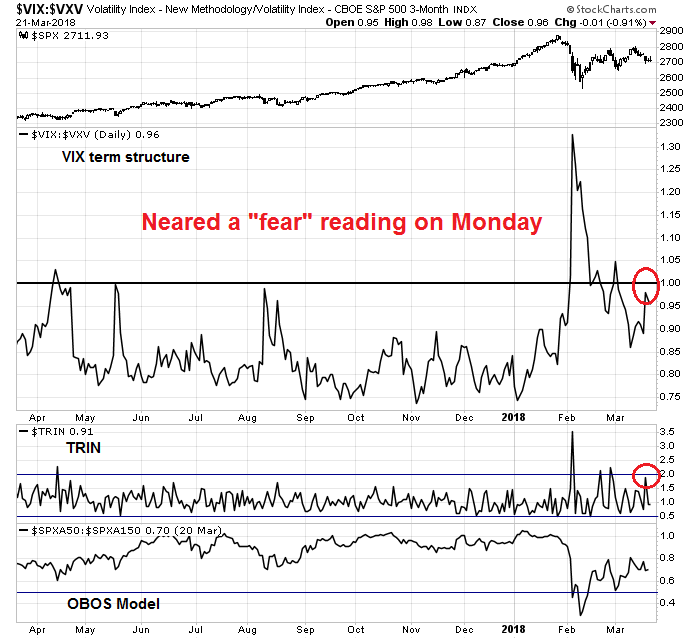
Sentiment readings in this week`s round of equity weakness ran short of capitulation levels, which may mean that sentiment is in need of a final flush. An analysis of my Trifecta Bottom Spotting Model tells the story. Monday’s sell-off saw the VIX term structure invert on an intra-day basis, but the VIX/VXV ratio did not close in fear territory. Similarly, TRIN neared a reading of 2, which is indicative of market capitulation, but did not close at that level.
If the market were to weaken, I would monitor different indicators for signs of positive divergence. As an example, will the Fear and Greed Index make a positive divergence if the market were to test the lows set in early March?

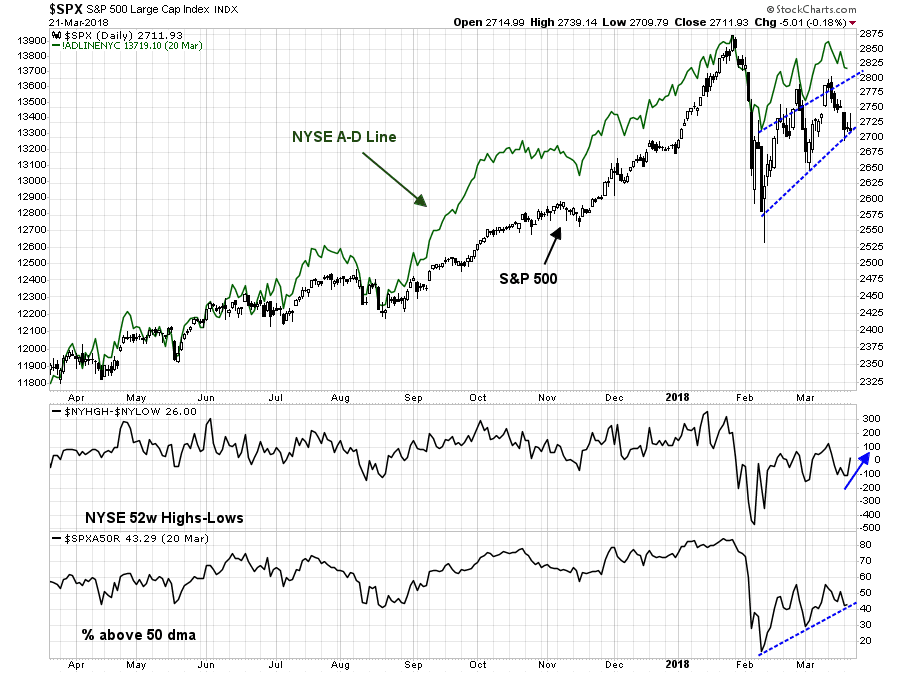
A number of breadth indicators are already displaying constructive signs of positive divergence.
My inner trader was caught long in the latest downdraft, but he remains cautiously bullish and believes that downside risk is limited at these levels.
Disclosure: Long SPXL
Humble,
Don’t you have fear divergences backward ? Ideally, you would want more fear at higher prices, not less fear.
Early today in European trading hours the S&P 500 futures dropped by more than 20 points within an hour and tested Monday’s lows – which makes me wonder if plunges in futures count as “panic flushes”. More recently we had seen lows during future hours hold within market hours, the instances I can remember were the Cohn resignation and the Feb 14 inflation release – but those were unexpected news releases.
Watch the VIX. Spot vix over 20, more toward the 40-50 range is definite high fear, and usually contrarian buy. See early February in this regard.
Low in the last quarter was 2530 give or take. Discounting the extreme of that range (see candlesticks, the lower wick, takes one to 2530, circa early February), 2550-2560 should be retest of that level, that is if the level holds.
See also short term Oversold graphs on major indices, say 20 DMA. There are other technicals that Cam has talked about.