The Federal Reserve is widely expected to raise interest rates a quarter-point this week at their FOMC meeting this week. Even though financial conditions remain at benign levels, there are a number of signs that stress levels are rising during the current tightening cycle.
Rising Libor-OIS spread
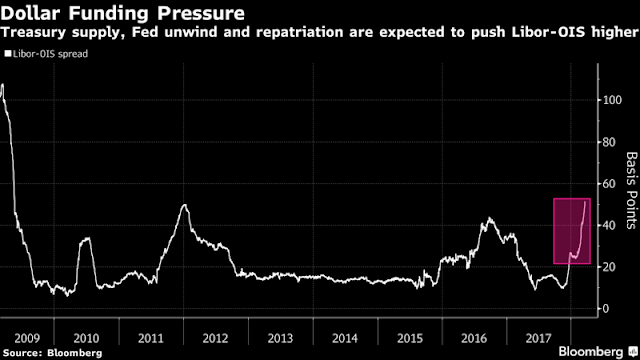
Bloomberg reported that stresses are showing up in the financial system as part of the Fed’s tightening process. The Libor-OIS spread is blowing out.
As a primer:
[The Libor-OIS spread is] regarded as a measure of how expensive or cheap it will be for banks to borrow, as shown by Libor, relative to a risk-free rate, the kind that’s paid by highly rated sovereign borrowers such as the U.S. government. The Libor-OIS spread provides a more complete picture of how the market is viewing credit conditions because it strips out the effects of underlying interest-rate moves, which are in turn affected by factors such as central bank policy, inflation and growth expectations.
The rising spread can be attributed to a number of factors:
- Higher Treasury Bill issuance
- The tax bill’s offshore cash repatriation provisions has shrunk the supply of overseas USD
- Quantitative Tightening, or the Fed’s shrinking balance sheet
Flattening yield curve
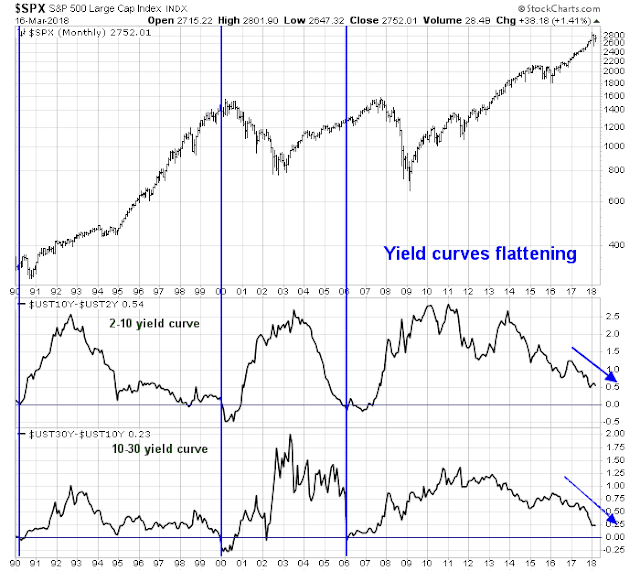
The yield curve has continued their flattening path, which is the bond market’s way of anticipating slowing future economic growth. Inverted yield curves have been sure-fire signs of recessions, which have been equity bull market killers in the past.
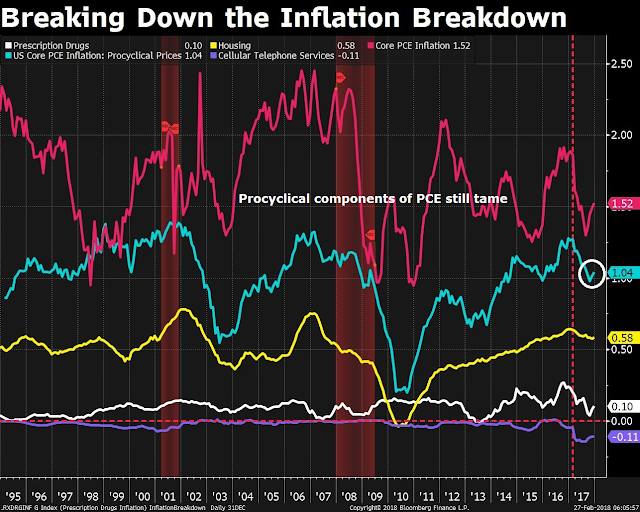
On the other hand, Matt Boesler of Bloomberg pointed out that even though core PCE has started to rise steadily, its pro-cyclical components remain tame. This may be a factor that holds down inflation pressures for the rest of 2018 and restrain the Fed from becoming overly aggressive in its rate hike path.
At this point, the market does not have a good handle of the Powell Fed’s reaction function to data and risks. Ultimately, the question for investors is whether there will be a Powell Put for the markets in the manner of the Yellen Put, Bernanke Put, and Greenspan Put.
Stay tuned. The first act of this show opens on Wednesday.


Hi Cam,
are you adding to long position in this blip? Nasdaq looks interesting at this moment.
what was the difference between 1994 which was stock marke tbuy and 2000 and 2007 crashes
I am not sure I understand the question. The yield curves came close to inversion in late 1994, but did not invert.
sorry I wasnt cllear …that was my question really…. why didnt it invert in 1994 ???…and are those reasons prevalent now or inversion will come this time???
I am not sure why it didn’t invert, but I see that the Fed was near the end of its tightening cycle. Maybe the market anticipated that event? I don’t remember.