The risk to growth and growth stocks

Ed Yardeni may have top-ticked large cap growth stocks last week by postulating that a melt-up may be underway, led by the FAANG names. As the chart below shows, FAANG as a percentage of SPX market cap has been rising steadily for the last few years and now account for 11.9% of SPX market cap.


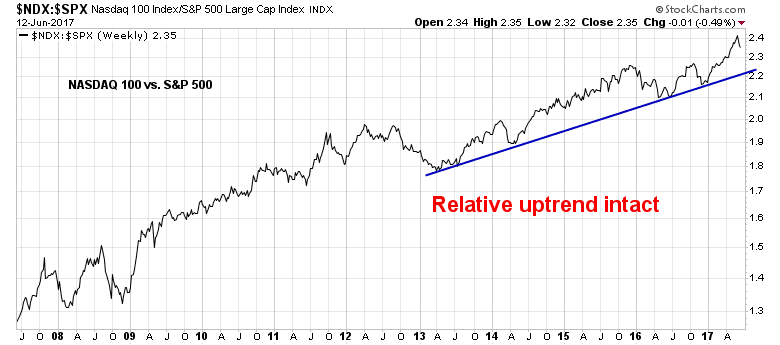
Despite the air pocket that these stocks hit on Friday, the relative market performance of the NASDAQ 100 still looks like a blip in an uptrend.


The relative performance of the Russell 1000 Growth Index compared to the Russell 1000 Value shows a higher degree of technical damage, but the relative uptrend of growth over value stocks also remains intact.


Looking into the remainder of 2017, however, there is a potential threat to earnings growth that investors should keep an eye on.

Are expectations too high?

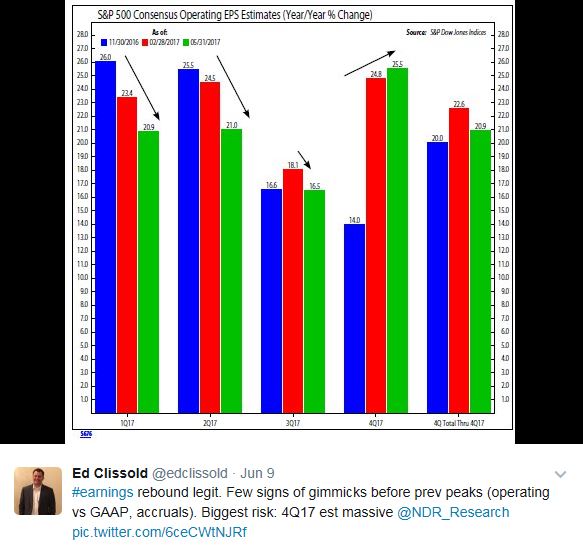
Ed Clissold at Ned Davis Research highlighted a possible threat to equity prices from 4Q 2017 earnings expectations. He noted that the current earnings rebound is real, as measured by earnings quality and the diminished level of buybacks, 4Q earnings expectations have been rising dramatically and therefore prone to disappointment.


Here is what is unusual about the upward revision in 4Q estimates. Historically, Street analysts have tended to estimate high and drop them as time passed. That`s why I have normalized estimates by using forward 12-month EPS to calculate forward P/E ratios.


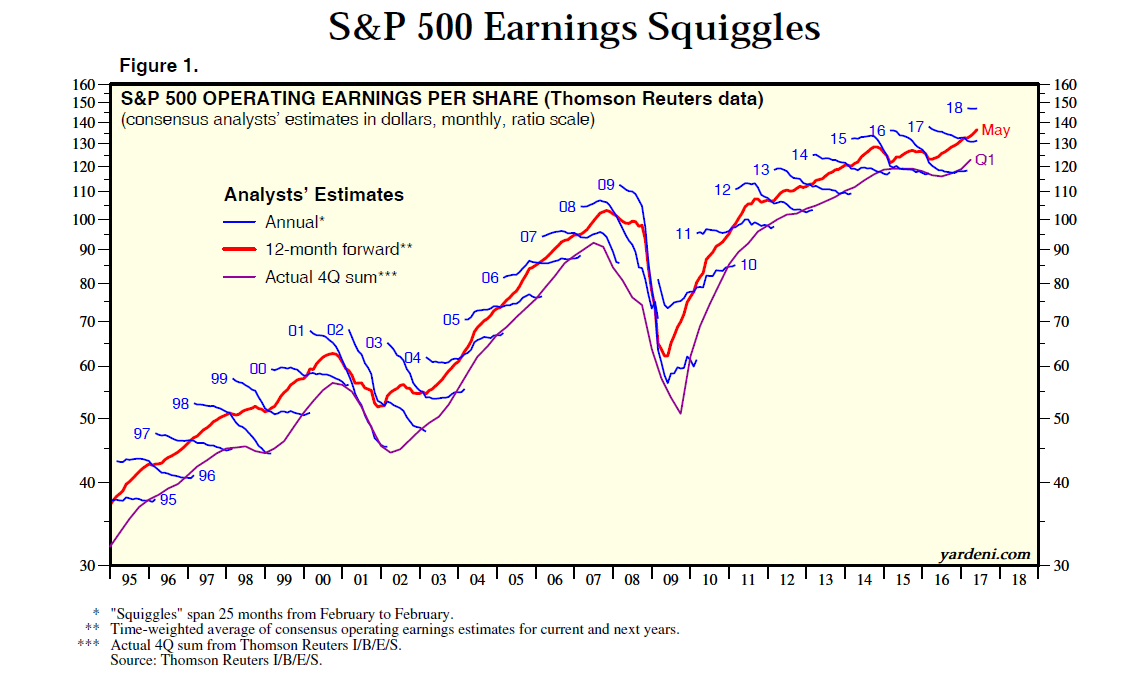
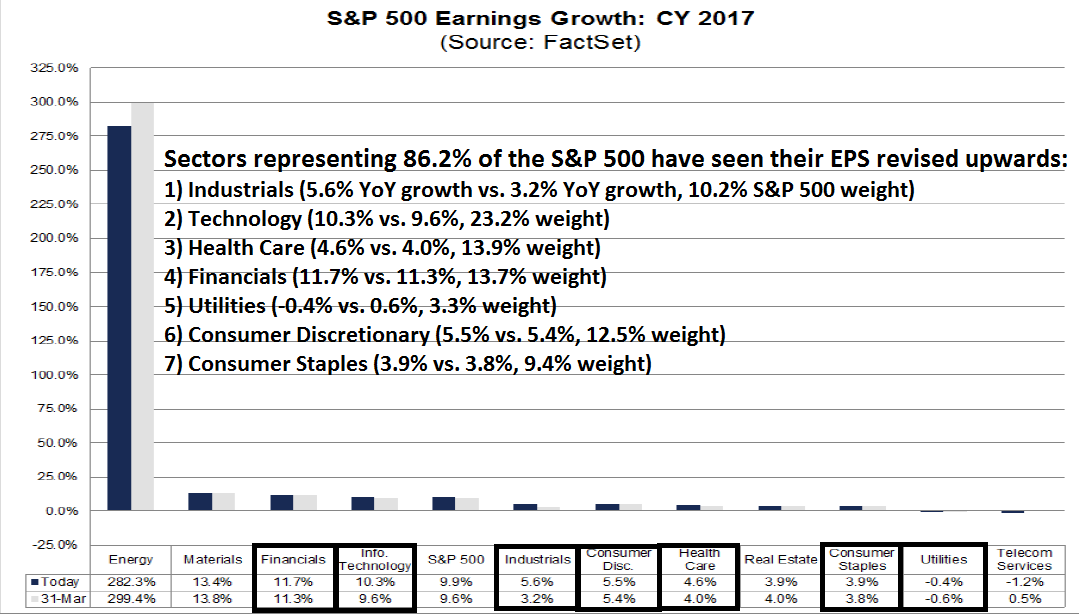
As Ed Clissold indicated in his analysis, 4Q EPS estimates bucked the historical trend by rising instead of falling. This chart from FactSet shows that the upward revisions in 2017 EPS from March to today have been broad based, and represent seven sectors with 86.2% of index weight. (Note that while the Energy sector is projected to have the greatest YoY growth, they were revised downwards).


EPS growth expectations are high for 4Q 2017 earnings. With growth stocks getting hammered Friday and today, it will be useful to keep the possibility of disappointment in mind, and not just for the high flying Technology glamour stocks.

3 thoughts on “The risk to growth and growth stocks

  1. If you look at Yardeni’s chart, you will see that the only times that yearly profit estimates start low and trend higher over a year is early in an economic recovery and early in a bull market for stocks. 2010 and 2011 recently and 2004, 2005 and 2006 before.

    The indicators I follow have said we started a new bull market early in 2016. There was a profits recession in 2015 but it was not nearly as deep as the previous two huge recessions so observers don’t count it. Also the S&P 500 and NASDAQ were the only major global indexes that didn’t go down the 20% bear market amount so observers still think we are in a now eight year bull market that should end soon. Before the huge 50% falling bear markets of 2000-2002 and 2008-2009, there were many bears that were fairly tiny with mild recessions. The GFC leaves us with a feeling that we need a collapsing economy with an extremely weak stock market to signal the end of a bull market. If you through a big rock into a pond, the first wave out is huge but they get smaller. 2015 was one of those smaller down waves (though a depression for commodity producers).

    What if we are just ending the first year of a new economic up cycle and bull market just like the Yardeni chart lows in 2002 and 2009? We would have lots of unexpected higher profits over the next two years just like those cycles. Stocks would climb a wall of worry since you and I and every money manager would be nervous stocks were too high. But up they would be dragged. Rising dividends will attract retired Boomers. Sweet times for those who are in.

    Early last year in this blog, I was beating the drum about how the markets had finished a bear market and were starting a new bull. I looked pretty stupid at the time since most strategists including my own firm’s, were saying we were seven years into a bull market and get ready for the bear to start soon. Since then we are up well over the 20% needed for a bull market measure. I feel just as foolish today saying we are only midway into this new bull market. But that’s what my indicators say.

    I do not wear rose colored glasses. I’m the only portfolio manager I’ve heard of that has missed the last three bear markets. My clients went up 8% in 2008 when the market fell 50% for example. We were up during the Tech Crash too. When my indicators of Value, Sentiment and Leading Economic Numbers flash red, I’ll get out. Here’s the December 2008 newspaper article;

    http://wandcv.com/wp-content/uploads/2016/07/ROBdec08-pdf-Adobe-Acrobat-Professional-28429.pdf

    In the case of technology stocks, if the global economy is growing and we know we are in a digital revolution that’s picking up the speed of change, I would not bail out of the group too easily or completely. This is not the year 2000 where everything was smoke and mirrors and no or little earnings. The smartphone is only ten years old. Robotics and AI are in an exponential rising curve. We are at an historic technology juncture.

    It may look from this post that I just want to blow my own horn. Not true. In saying that we are just mid-way into a new bull market that started a year ago, I realize how stupid and amateurish that sounds. I realize it is classic “This time it’s different talk.” So I have to throw out some proofs that I’m not just an overconfident guy that’s on a recent lucky streak that doesn’t know what he doesn’t know. I’ve had a forty year in depth schooling with all the humbling knocks.

  2. Ken,

    I always enjoy, and look forward to, your perspective in the comments section. Also, I have made some investment decisions based on your “Lower for longer” strategy, which are looking pretty good so far. So, please continue to contribute, and I for can definitely say, you are not just blowing your own horn. =)

    Thanks again.

Comments are closed.