Preface: Explaining our market timing models
We maintain several market timing models, each with differing time horizons. The “Ultimate Market Timing Model” is a long-term market timing model based on the research outlined in our post, Building the ultimate market timing model. This model tends to generate only a handful of signals each decade.
The Trend Model is an asset allocation model which applies trend following principles based on the inputs of global stock and commodity price. This model has a shorter time horizon and tends to turn over about 4-6 times a year. In essence, it seeks to answer the question, “Is the trend in the global economy expansion (bullish) or contraction (bearish)?”
My inner trader uses the trading component of the Trend Model to look for changes in the direction of the main Trend Model signal. A bullish Trend Model signal that gets less bullish is a trading “sell” signal. Conversely, a bearish Trend Model signal that gets less bearish is a trading “buy” signal. The history of actual out-of-sample (not backtested) signals of the trading model are shown by the arrows in the chart below. Past trading of the trading model has shown turnover rates of about 200% per month.
The latest signals of each model are as follows:
- Ultimate market timing model: Buy equities
- Trend Model signal: Risk-on
- Trading model: Bearish (downgrade)
Update schedule: I generally update model readings on my site on weekends and tweet mid-week observations at @humblestudent. Subscribers will also receive email notices of any changes in my trading portfolio.
A Fed pause ahead?
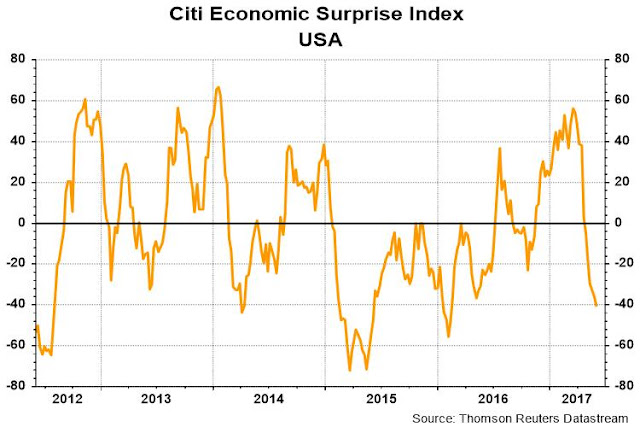
So far, my base case for the American economy and stock market has been a “thrust and bust” scenario, where the economy continues to grow and overheats, which is then followed by a Fed induced bust. However, the combination of softer macro-economic data, as exemplified by the falling Citigroup Economic Surprise Index…
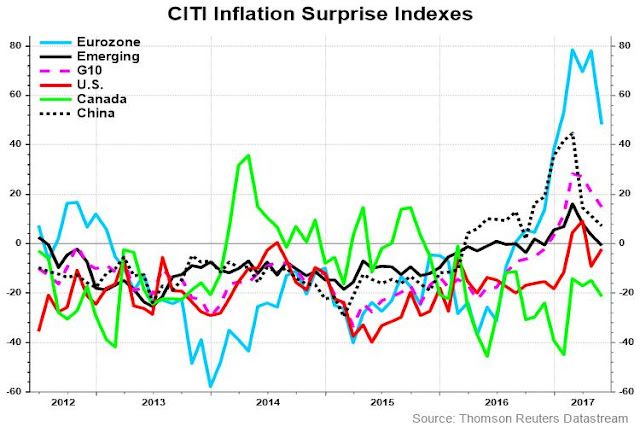
And an undershoot in inflation expectations has caused the market to re-assess the probability of the “thrust and bust” scenario. In particular, the decline in inflationary expectations has been global in scope, though the US (red line) has stabilized.
Friday’s release of the May Jobs Report is a typical example of the weak macro theme. Not only did headline employment miss expectations, employment for previous months was revised downwards. Even though a June rate hike is more or less baked in, the big question is whether the Fed is likely to pause its rate normalization policy in light of disappointing inflation and growth statistics.
The official Federal Reserve view
Fed governor Lael Brainard laid out the official party line in a speech she made last week. Brainard had been an uber-dove on the Fed board, but she made it clear that it’s time to start normalizing monetary policy:
On balance, when assessing economic activity and its likely evolution, it would be reasonable to conclude that further removal of accommodation will likely be appropriate soon. As I noted earlier, the unemployment rate is now at 4.4 percent, and we are seeing improvement in other measures of labor market slack, such as participation and the share of those working part time for economic reasons. There are good reasons to believe that the improvement in real economic activity will continue: Financial conditions remain supportive. Indicators of sentiment remain positive. The balance of risks at home has shifted favorably, downside risks from abroad are lower than they have been in several years, and we are seeing synchronous global growth.
She went on to acknowledge that a shrinkage of the Fed’s balance sheet is also a form of monetary tightening. Both the Fed Funds rate and balance sheet reduction are tools of monetary policy and therefore substitutes for each other:
These effects [of balance sheet normalization] are, of course, in many respects, similar to the effects of increases in short-term interest rates. Thus, away from the zero lower bound, the two tools are, to a large extent, substitutes for one another. As a result, the FOMC will be in the unfamiliar posture of having two tools available for adjusting monetary policy.
However, she favors the use of the Fed Funds rate as the primary monetary policy tool. Once the Fed begins to reduce its balance sheet, the process is likely to be put on “auto-pilot”:
Under the subordinated balance sheet approach, once the change in reinvestment policy is triggered, the balance sheet would essentially be set on autopilot to shrink passively until it reaches a neutral level, expanding in line with the demand for currency thereafter. I favor an approach that would gradually and predictably increase the maximum amount of securities the market will be required to absorb each month, while avoiding spikes. Thus, in an abundance of caution, I prefer to cap monthly redemptions at a pace that gradually increases over a fixed period. In addition, I would be inclined to follow a similar approach in managing the reduction of the holdings of Treasury securities and mortgage-backed securities (MBS), calibrated according to their particular characteristics.
However, Brainard did conclude with a cautionary remark that the Fed may reassess their monetary policy normalization path should inflation continue to decelerate:
While that remains my baseline expectation, I will be watching carefully for any signs that progress toward our inflation objective is slowing. With a low neutral real rate, achieving our symmetric inflation target is more important than ever in order to preserve some room for conventional policy to buffer adverse developments in the economy. If the soft inflation data persist, that would be concerning and, ultimately, could lead me to reassess the appropriate path of policy.
Despite the soft May Jobs Report, Bloomberg reported that Fedspeak showed no wavering of its policy normalization course:
Fed officials speaking on Friday expressed no disappointment with the payrolls gain of 138,000 last month, which was below economists’ expectations. Philadelphia Fed President Patrick Harker called it a “good number,” while Dallas Fed President Robert Kaplan said “if we are not at full employment, we are moving closer.”
What’s the Fed’s reaction function?
What Lael Brainard outlined is the current view of the Fed. However, there are a couple of questions marks that revolve around the trajectory of Fed policy.
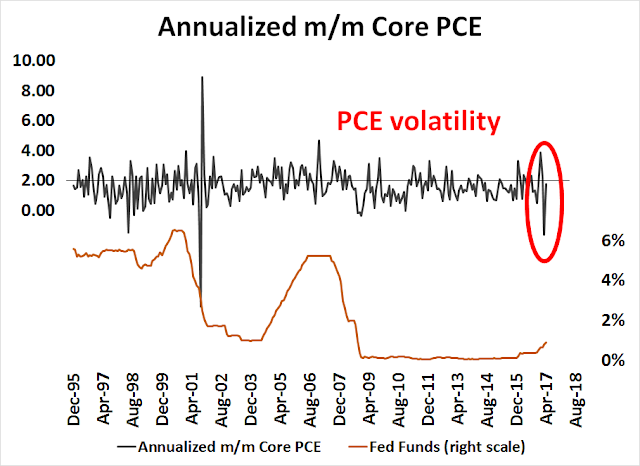
First of all, it is unclear what the Fed’s reaction function to inflation actually is, despite her promise to “reassess the appropriate path of policy”. The current policy framework is based on the Philips Curve, which assumes a trade-off between unemployment and inflation and inflationary expectations. The chart below shows the history of annualized monthly change in core PCE, which is the Fed’s preferred inflation metric, and the Fed Funds Rate. Recently, core PCE has experienced considerable volatility and actually fell an annualized -1.6% in March. On the other hand, there was a dramatic change in tone of policy that began in March, when Fed officials went on an active campaign to warn the market that a rate hike was more or less inevitable at its March FOMC meeting. So how quick will the Fed be to react to slowing inflation?
Historically, the Fed has become more aggressive in raising rates when the incidence of annualized monthly core PCE above 2%, which is the Fed’s inflation target, has exceeded 6 in the past 12 months, with the exception of the Greek debt crisis of 2011. As the chart below shows, this metric reached 5 but it has begun to back off, indicating falling inflation pressures.
Here is an uncomfortable question for equity bulls. If the Fed is intent on raising rates in the face of falling inflation pressures, what happens when inflation really heats up?
Political wildcards
As well, there are several political wildcards in play as three Fed board seats are still open and the future of monetary policy is dependent on who gets appointed, as well as the fate of Janet Yellen as Fed chair because her term ends in February 2018. The New York Times reported on Friday:
The Trump administration has selected candidates for at least two of the three open positions on the Federal Reserve’s Board of Governors, according to people with direct knowledge of the decision. The expected nominees include Randal K. Quarles, a Treasury Department official in the George W. Bush administration, and Marvin Goodfriend, a former Fed official who is now a professor of economics at Carnegie Mellon University.
It turns out both of these candidates are hard-money advocates who favor a rules-based approach to monetary policy:
Mr. Quarles and Mr. Goodfriend have expressed support for the idea that the Federal Reserve should adopt a more formulaic approach to policy-making. House Republicans have proposed legislation that would require the Fed to articulate a policy rule — a mathematical approach to determining the level of interest rates — that would limit the role of human judgment in monetary policy.
“If you’re going to be transparent in an activity like the Fed, you have to be much more rule-based in what you’re doing,” Mr. Quarles told Bloomberg Television in 2015. He described the Fed’s current approach as “a crazy way to run a railroad.”
If you read nothing else, Goodfriend’s paper “The Fed Needs a Credible Commitment to Price Stability“, is all you need to know about his philosophy. Moreover, FT Alphaville pointed out that Goodfriend has some unconventional ideas about implementing negative interest rates, and believe therefore that central banks should not afraid of the zero bound.
The appointment of Quarles and Goodfriend would steer Fed policy in a much hawkish direction than the current Fed. That’s because any rules-based monetary policy decision process would see that the Fed Funds target dramatically higher than what it is today. As the chart below shows, unemployment (red line) is already 4.3%, which is at the low end of the historical range, why is the real Fed Funds rate (blue line) still negative?
On the other hand, the website Axios reported that Trump’s chief economic advisor Gary Cohn is interested in the job of Fed chair. Bloomberg later reported that Cohn denied his interest in the job. Although Cohn has little publicly about the conduct of monetary policy, his appointment would set a very different tone for the Fed. Fed chairs and governors have traditionally come from academia, and academics tend to go through a learning curve about the markets once they settle into their position. Cohn is no academic, but comes from the rough and tumble world of Wall Street. The best parallel to a possible Cohn Fed would be the Greenspan Fed. Alan Greenspan had been a Wall Street forecaster and he was a far more market savvy Fed chair than a Bernanke or Yellen, who came from universities.
As an example, the pair of Greenspan at the Fed and Rubin at Treasury was a formidable duo when it came to currency intervention. Instead of starting intervention during US trading hours, programs would begin during Tokyo hours when the market was far less liquid. Traders would then wake up and find that they were dramatically underwater on their positions.
In all likelihood, a Fed led by Gary Cohn, or someone else with a similar Wall Street profile, would be far more pragmatic than the typical Republican hard-money, audit-the-Fed, rules-based monetary policy favoring academic. In fact, he might exactly the kind of low interest rate person that Donald Trump would want at the Fed.
In conclusion, I have no idea of how all these factors will pan out. My crystal ball is in the shop right now. In the absence of influence of new Fed governors, Fed watcher Tim Duy believes that the Fed will be relatively slow to react to slowing inflation and growth:
The Fed’s focus remains on the labor market. Hence, they remain focused on two rate hikes and balance sheet action still to come this year. One of those rate hikes will come this month. If sustained, weak inflation will eventually push them to rethink the path of policy. But the impact of those changes might fall more on 2018 than on 2017.
If Duy is correct about the slowness of the current Fed’s reaction function, then the “lower for longer” scenario is not likely to have much credence, especially in light of the Fed’s about-face in March of guiding rates higher when Q1 economic conditions were softening. In addition, monetary policy is likely to take a more hawkish turn if Quarles and Goodfriend, or others with their profile, are appointed to the Fed’s board of governors.
The message from the market
In the meantime, the market has developed its own opinions about handicapping the “thrust and bust” and “lower for longer” scenarios. The bond market thinks that the economy is starting to slow, and therefore a “lower for longer” policy is probably the more appropriate policy.
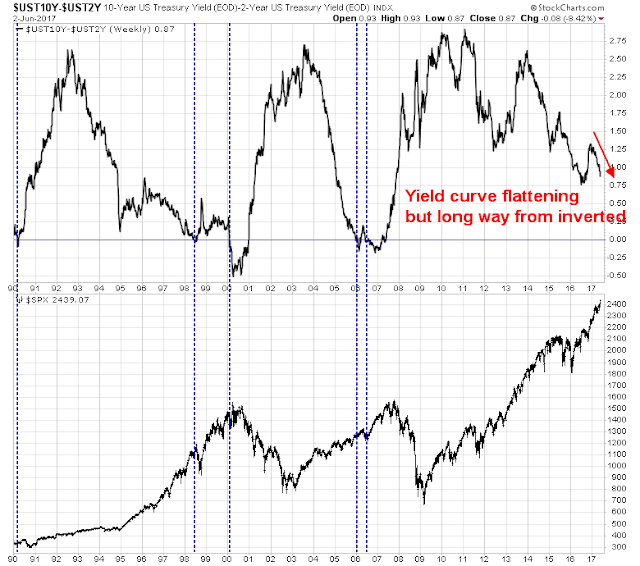
The 2/10 Treasury yield curve is flattening and it fell to 87bp on Friday, which is a reflection of slower growth expectations. Though readings are far from zero, which has historically been a recession signal, the dramatic change is worrisome and something to keep an eye on.
Risk appetite, as signaled by the bond market, is also diminishing. The top panel of the chart below shows the relative price performance of high yield, or junk bonds, compared to equivalent duration Treasuries (blue line). As the chart shows, even as the SPX rallied to new all-time highs, the relative performance of HY did not. On Friday, even as the SPX made another fresh high, HY relative returns edged down for another negative divergence.
The second panel of the chart shows that even as the stock market rose to new highs, investors would have been better off in long Treasury bonds. The blue line shows the relative performance of stocks vs. bonds declining since March, which is another negative divergence in risk appetite.
The bond market is spooked by the longer term growth outlook.
The message from the stock market
By contrast, the stock market appears to be focused on the shorter term growth picture. The inverse correlation between initial jobless claims (blue line, inverted scale), which is a coincident economic indicator, and stock prices (red line) has been one of the more remarkable and stable relationships in this cycle.
The latest update from FactSet shows that forward 12-month EPS is still rising nicely.
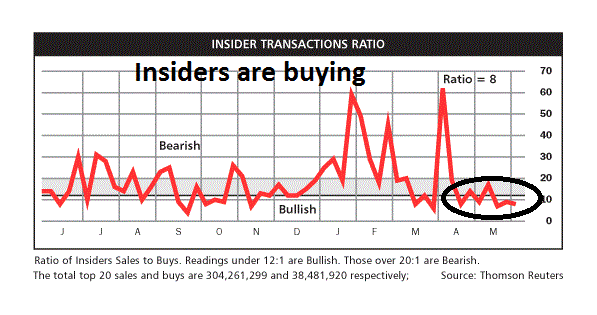
The latest report from Barron’s of insider activity shows that this group of “smart investors” continue to be in buy mode. So what are you so worried about?
The risks to stock prices
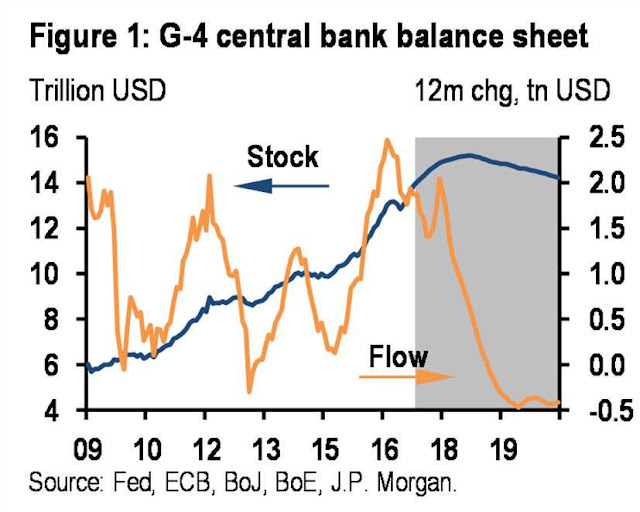
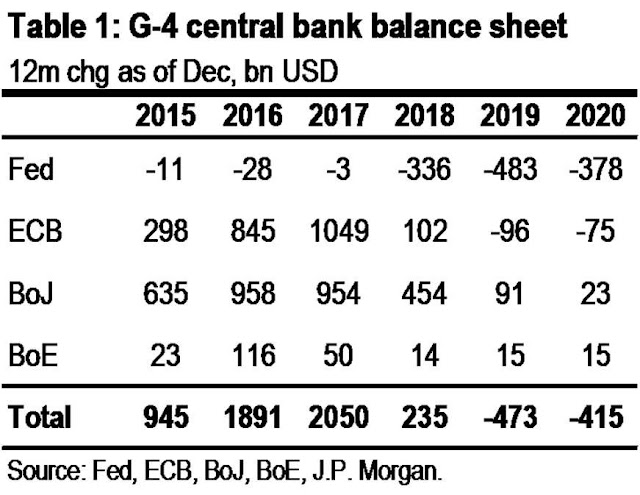
Here are the key risks to stock prices. Looking into 2018 and beyond, the global monetary policy environment is likely to be far less stimulative than it is today. This chart from JP Morgan shows how the balance sheets of G-4 central banks are likely to peak out next year and begin to shrink in 2019 as QE programs reverse themselves.
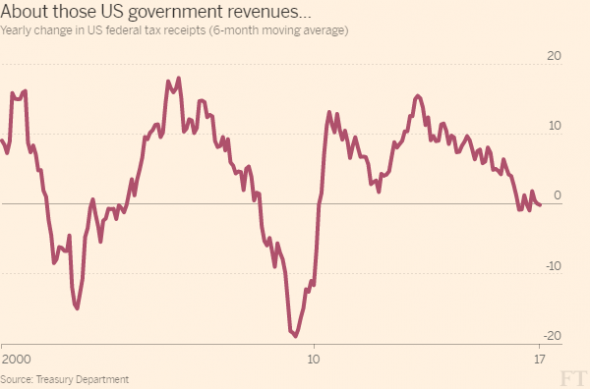
One of the fears for market bulls is that the Fed is headed for a policy error as it misses signals of economic weakness and tightens into a flagging economy. A sign that the economic cycle may be peaking comes from an analysis of tax receipts. FT Alphaville pointed out that YoY federal tax receipts are falling. The bull case is these are just the signs of a late cycle expansion. The bear case is declining tax receipts indicate a weakening economy.
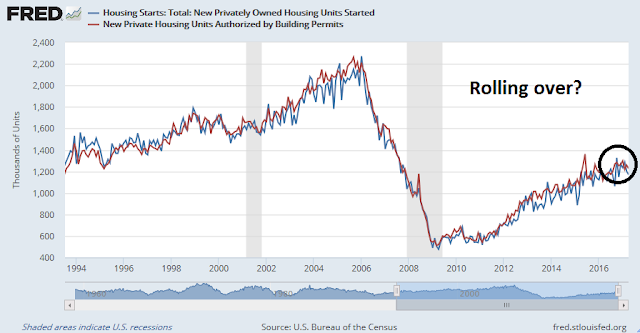
Another warning sign comes from housing, which is a highly cyclical component of the economy and a key long leading indicator. This sector may have peaked for this cycle. Both housing starts (blue line) and housing permits (red line) are showing signs of rolling over. To be sure, both of these data series are very noisy and can be weather dependent. As well, the May Jobs Report showed that construction jobs +11K m/m and +191K y/y, so there is no need to panic just yet.
In addition, New Deal democrat warned that corporate profits may have seen the highs of this cycle. That’s important because “corporate profits as deflated by unit labor costs is one of the four long leading indicators identified by Prof. Geoffrey Moore, who was responsible for the publication of the Index of Leading Indicators for several decades.”
However you measure corporate profits, whether normalized by inflation (blue line) or (unit labor costs), the chart below shows that they appeared to have peaked out. Past instances of peaks have been precursors to economic recessions.
NDD sounded a warning similar to the one I voiced last week (see When will the market top out?):
This relationship makes it look like there is not a lot of upside potential in stock prices, at least as measured quarterly. Moreover, if corporate profits have peaked for this cycle, then it would be expected that a cycle peak in stock prices in the next 12 months is a pretty good bet.
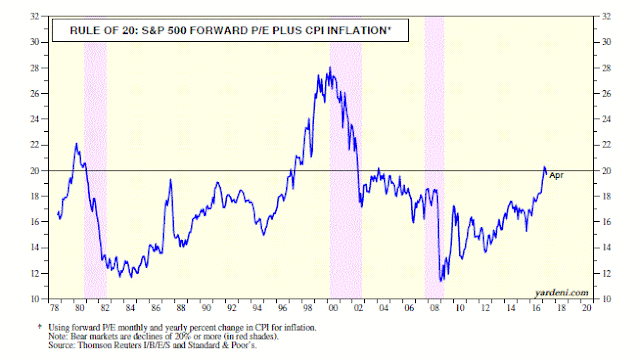
As well, Ed Yardeni recently sounded a warning on equity valuation. He observed that the Rule of 20, which states that forward P/E plus CPI inflation should not be above 20, had flashed a sell signal.
To be sure, Yardeni did concede that not all models were that bearish. The Fed Model still shows that stocks are undervalued by 61.9%, as long as rates stay low, growth continues, and inflation remains tame:
This confirms Buffett’s assessment that stocks are relatively cheap compared to bonds. If more investors conclude that economic growth (with low unemployment) and inflation may remain subdued for a long while, then they should conclude that economic growth and inflation may remain historically low.
Contrarian alarm bells
From a contrarian perspective, alarm bells began ringing when the FT reported that well-known value investor Jeremy Grantham threw in the towel on equity valuation and declared this a new era:
“Even a crash like 2008 wasn’t enough to knock the market off this new rail,” Mr. Grantham said. “The ground has shifted quite a bit.”
Arguing that this time is different, and valuation metrics have climbed to a long-term new average, is near sacrilege for many value investors, who base their style on seminal work done by academics such as Benjamin Graham in the 1930s and popularised by the likes of Warren Buffett.
Mr. Grantham admits his new tone gets “groans from fellow value investors” where it has “rattled a lot of cages”, but argued that previously dependable rules have to be re-examined and some even cast aside, given that the the “world has changed”.
At a tactical level, Bamabroker tweeted on Friday that his most contrarian client had also thrown in the towel and was chasing AMZN and NFLX.
The week ahead
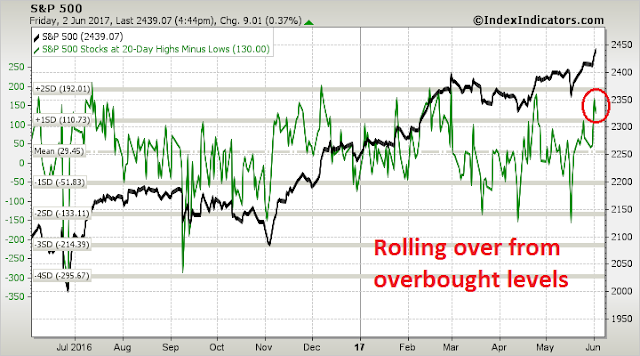
Looking to the week ahead, I was regrettably early in tactically turning bearish (see Possible market turbulence ahead). However, short-term (1-2 day time horizon) breadth from Index Indicators shows that the market is rolling over from overbought levels.
As well, longer term (1-2 week) breadth is also flashing similar cautionary readings.
From a historical perspective, Jeff Hirsch at Almanac Trader pointed out that June seasonality shows that stock prices tend to plateau next week and weaken the following week.
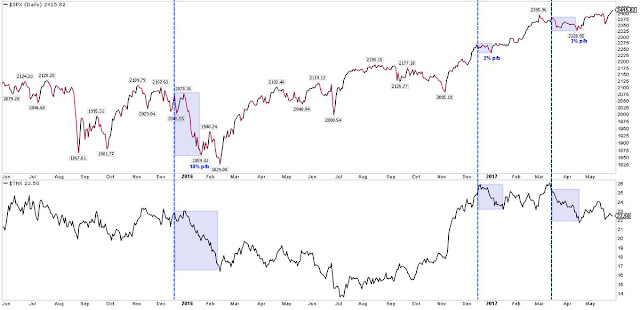
Looking further at the market’s behavior the following week, Urban Carmel observed that equity prices tended to be flat to down after the last three Fed rate hikes, while bond yields have fallen.
Even if you are an equity bull, some caution is warranted for the next few weeks.
A matter of time horizon
My inner investor remains bullishly positioned, though he is starting to get a little nervous. He is unlikely to alter his portfolio positioning until he gets greater confirmation of fundamental and macro weakness, or indications of a more hawkish Fed. The difference of opinion between the stock and bond markets can be attributable to a difference of time horizon. The stock market appears to have a shorter time horizon (2-3 months), which is still bullish, while the bond market is focused longer term (6-12 months), which is a bit more wobbly. New Deal democrat summarized current conditions well in his weekly monitor of high frequency economic releases:
There were a few more neutrals and negatives this week, primarily among coincident indicators.
Nevertheless, the nowcast for the economy remains positive, as does the near term forecast. The longer term forecast also remains neutral to positive, shading a little closer to neutral based on recent data.
My inner trader is modestly short and he may add to his short position should stock prices grind higher next week.
Disclosure: Long TZA







Some strategists are saying Trump’s withdrawal from the Paris Accord is bearish. I say no, it’s very market bullish. He is shouting “I only care about American jobs”. Now other countries will be saying, they want to promote their own country’s job market. That’s all good for global growth.
I quote from this article:
“Here is an uncomfortable question for equity bulls. If the Fed is intent on raising rates in the face of falling inflation pressures, what happens when inflation really heats up?”
There is evidence in this article that raises the question whether deflation (not inflation) is round the corner. US 10 year note is now below 200 day moving average (let us pencil in 2.20%), closed on friday at 2.15-9. The G4 is withdrawing QE. Gold bounced off 1250$. This time it may be indicating deflation around the corner, bond market rally supports this idea (gold rallies both in inflationary and deflationary times).
Cam has suggested we are likely to be within say a 12-18 months give or take to a peak. Perhaps we are within 10% of a stock market peak as well. Corporate profits as a percentage GDP is running close to an all time peak. Margin debt is at an all time peak as well (https://www.advisorperspectives.com/dshort/updates/2017/05/31/a-look-at-nyse-margin-debt-and-the-market). Unemployment rate is at an all time low at 4.6% (U6). Total unemployed in the US is around 22% give or take (https://fred.stlouisfed.org/series/LNS13025703). Of course, we will not talk about the latter (22%) in this post. We are in the ninth year of an equity bull market which is one of the longer bull markets.
Cam’s point is well taken here. Data in the next few months will be critical to make a judgement whether we are peering into a deflationary or inflationary scenario. That said, something does not feel right, under the hood.