From alpha to actual returns: Why your mileage will vary
Posted by Cam Hui -
One of the characteristics of a good financial modeler is to know his model’s limitations. He know how and why they work, and under what circumstances they will fail.
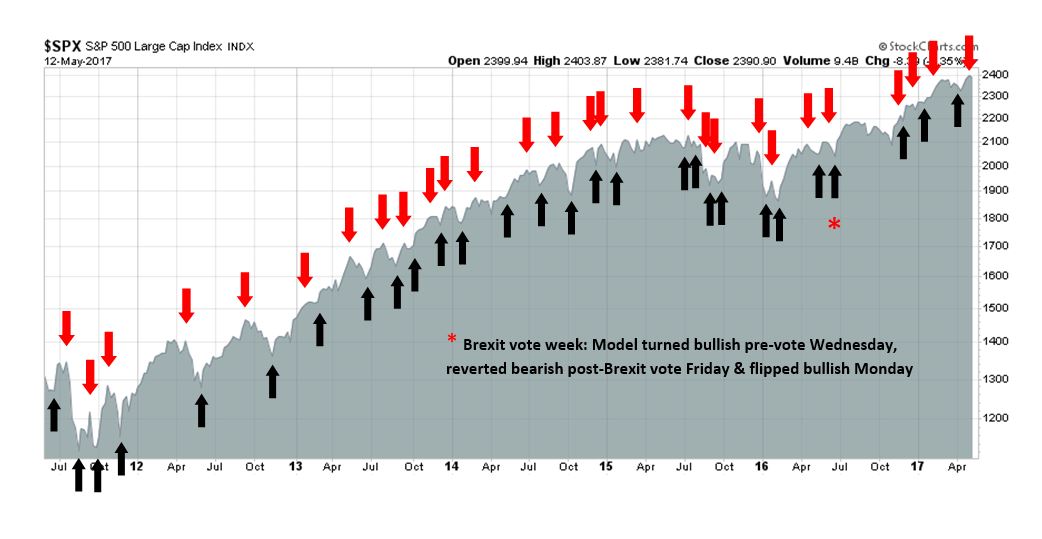
I have been asked a number of times in the past to disclose the returns of my trading account, or the signal dates of my trading model, whose out-of-sample buy and sell signals are shown below. I have resisted those requests because the disclosure of the data leads to a false level of precision in return that readers cannot expect.
The process of turning a forecast alpha, or signal, into actual portfolio return is a tricky one. There are three decisions that have to be made:
What and when do you buy and sell?
How much do you buy and sell?
How do you time the trade?
The “arrows” in the above chart only answer question 1.
The answer to the second question depends on the trader’s personal circumstances. What is his risk tolerance, or pain threshold? What are the tax consequences of the trade? How much conviction does he have in the signal? Should he scale into a position? If the trade turns against him, how does he manage his risk, or should he average down? Conversely, should he take partial profits if the trade moves in his favor?
I know nothing about my readers. I know nothing about the answers to any of the above questions. If I was a portfolio manager of an actual fund that uses this strategy, then there would be disclosure documents specifying the kinds of risks an investor can expect, as well as the tax implications of investing in the fund.
Execution timing
Then there is the problem of timing the trade. The above chart is a weekly price chart that uses closing prices. The chart below shows the same signals overlaid on daily high/low/closing prices. This chart highlights the problems of noise relating to trade execution.
First, I should disclose that the “arrows” were placed on the Friday of each week, regardless of when the trading signal occurred. That’s because the signals were historically published on Fridays and therefore their placement was based on the date of publication. It also underlines the point that this model is meant to be a swing trading model with time horizons of weeks, not hours or days.
Here is where the process of return calculation gets noisy. From January 2, 1990 to today, the median swing from low to high on a daily basis was 1.04%. Assuming “typical” single point execution, that would introduce a return error of 0.52% (half of 1.04%). On top of that, add the variation of a few days from signal generation to the Friday publication date, and returns can change even more dramatically. Similarly, the median daily swing of the SPX on a closing basis during the same time period was 0.52%. Delay the signal by a few days, and it adds even more noise to the return calculations and assumptions.
With those caveats in mind, I have highlighted a number of past signals in the above chart that may prove to be problematical for a trader who is intolerant of drawdowns:
January to March 2013: The market continued to rise after the sell signal. Even after the market weakened, the buy signal occurred late after the bottom.
May 2013: The sell signal was early, and the market rose after the signal before falling dramatically. A risk averse trader could have been either discouraged or got stopped out of that trade.
February 2014: The market was flat and choppy after the sell signal. Depending on how the trader executed the original entry, he could have bounced around between slight breakeven and losses for several weeks before actually profiting. Does he have that kind of temperament?
March 2015: The market action after the sell signal was very similar to the February 2014 signal.
August 2015: Here, the trading model was simply wrong. The market fell and got oversold, which prompted the model to get long. Unfortunately, the market got even more oversold and this was one of the worst drawdowns suffered by the trading model.
June 2016 (Brexit whipsaw): The trading model got whipsawed badly. It flashed a sell signal after being long into the Brexit vote. It then reversed back into a buy signal the following trading day.
These are just some of the examples. In 2017, the trading model has been early in many of its signals, though the subsequent drawdowns have been relatively minor.
A lesson in portfolio dispersion
This exercise is a good illustration of the problems of backtesting. In this case, these were actual out-of-sample signals. But give them to two people and watch them turn the signals into actual portfolio performance.and the results can be wildly different. That’s why I have resisted the publication of a model portfolio. Even the publication of signal publication dates can lead to misleading results*.
The depiction of the signals using weekly price charts is intended to make the point of the time horizon of these trading signals. They last for weeks, not days, or hours. Imposing daily data, or worse still, hourly data, on weekly signals introduces an element of noise and uncertainty into the risk and return calculations.
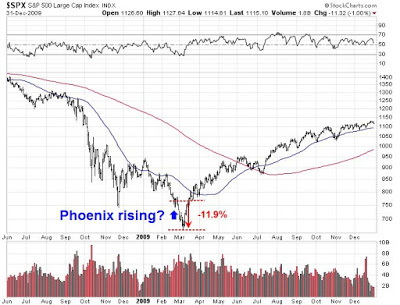
Here is another example of an exercise in risk tolerance and investment time horizon. On February 24, 2009, which was a week before the Lehman Crisis panic bottom, I wrote a post suggesting the speculative purchase of beaten up, low-priced stocks with insider buying. Pretty good timing, right?
Unfortunately, the market fell 11.9% from the date of that post to the March bottom. Was that a good trade, or would you have gotten stopped out after a drawdown of over 10%?
Teaching readers how to fish
I built Humble Student of the Markets as a forum to teach my readers how to fish. This is not a site with pre-packaged and pre-digested trading signals. There are trading chatrooms that offer those services (and with a much higher fee structure).
Your objectives and pain thresholds are different than mine. That’s why your mileage will vary.
* In the interest of full disclosure, the history of the trading signals can be compiled by reading past posts on the current Humble Student of the Markets site, and its old free legacy site. Readers who really want the dates of the signals can compile it themselves. That’s one of the first steps to learning how to fish.
6 thoughts on “From alpha to actual returns: Why your mileage will vary”
Thanks–very good discussion topic!
Agreed,it’s all about risk tolerance,timing &position size.
I use Cam’s calls to adjust my exposure rather than go long or short the leveraged ETFs – that’s an approach I am comfortable with. Lightening my exposure may include selling calls on held positions and/or just selling weak performers and not replacing them. I agree we can’t rely on a script supplied by Cam because all investors are different, not only due to financial factors but personality as well. Thanks Cam.
I love this commentary. So many people don’t get that trade decisions are made without foresight. And no matter how Spock-like you are, there is always an emotional component to a trade, driven by the unknown. In hindsight we learn and make adjustments. Interesting comment – “The depiction of the signals using weekly price charts is intended to make the point of the time horizon of these trading signals. They last for weeks, not days, or hours. Imposing daily data, or worse still, hourly data, on weekly signals introduces an element of noise and uncertainty into the risk and return calculations.” I have actually simplified my models quite a bit in order to filter out a lot of this noise. KISS. In my case, that’s meant trading end of month or end of quarter. Sometimes it’s dicey, like with Brexit, but other times, it allows the daily/hourly noise to resolve in the direction of the overall trend. Thanks for the real world insights.
Behavioral economics has proven that every time we make a trade our human biases are working against us. This is why it’s imperative to have a rule structure built beforehand. The biggest bias errors occur in the heat of the battle when we ditch our rules.
The only time to change ones rules is after the volatile period when markets are tranquil and you can look back calmly and analyze if new information should lead you to change your rules.
I also only use indicators that I can access consistently like Cam’s trifecta. I know he will publish it when there is a signal. Sometimes I read an article that describes a new trading tool that tells me to sell during a volatile market when my biases are screaming for me to sell. If I can’t access the tool in future I ignore it. Even if I can access it in future to add it, I wait until after that period of volatility is over and I can do so rationally.
I believe a key to effective trading is not becoming Mr. Spock-like, because we can’t. It’s understanding how our biases work against us and having some humility around our ability to overcome them.
Ken, those are wise words. I agree we can’t became Spock. But if we follow the rules often enough it becomes so routine and ingrained that it simply becomes unnatural to violate them.
Comments are closed.
About cookies on this site
Our site uses cookies and other technologies so that we, and our partners, can remember you and tailor your user experience on our site. See our disclaimer page on our privacy policy, how we manage cookies, and how to opt out. Further use of this site will be considered consent.

Thanks–very good discussion topic!
Agreed,it’s all about risk tolerance,timing &position size.
I use Cam’s calls to adjust my exposure rather than go long or short the leveraged ETFs – that’s an approach I am comfortable with. Lightening my exposure may include selling calls on held positions and/or just selling weak performers and not replacing them. I agree we can’t rely on a script supplied by Cam because all investors are different, not only due to financial factors but personality as well. Thanks Cam.
I love this commentary. So many people don’t get that trade decisions are made without foresight. And no matter how Spock-like you are, there is always an emotional component to a trade, driven by the unknown. In hindsight we learn and make adjustments. Interesting comment – “The depiction of the signals using weekly price charts is intended to make the point of the time horizon of these trading signals. They last for weeks, not days, or hours. Imposing daily data, or worse still, hourly data, on weekly signals introduces an element of noise and uncertainty into the risk and return calculations.” I have actually simplified my models quite a bit in order to filter out a lot of this noise. KISS. In my case, that’s meant trading end of month or end of quarter. Sometimes it’s dicey, like with Brexit, but other times, it allows the daily/hourly noise to resolve in the direction of the overall trend. Thanks for the real world insights.
Behavioral economics has proven that every time we make a trade our human biases are working against us. This is why it’s imperative to have a rule structure built beforehand. The biggest bias errors occur in the heat of the battle when we ditch our rules.
The only time to change ones rules is after the volatile period when markets are tranquil and you can look back calmly and analyze if new information should lead you to change your rules.
I also only use indicators that I can access consistently like Cam’s trifecta. I know he will publish it when there is a signal. Sometimes I read an article that describes a new trading tool that tells me to sell during a volatile market when my biases are screaming for me to sell. If I can’t access the tool in future I ignore it. Even if I can access it in future to add it, I wait until after that period of volatility is over and I can do so rationally.
I believe a key to effective trading is not becoming Mr. Spock-like, because we can’t. It’s understanding how our biases work against us and having some humility around our ability to overcome them.
Ken, those are wise words. I agree we can’t became Spock. But if we follow the rules often enough it becomes so routine and ingrained that it simply becomes unnatural to violate them.