Preface: Explaining our market timing models
We maintain several market timing models, each with differing time horizons. The “Ultimate Market Timing Model” is a long-term market timing model based on the research outlined in our post, Building the ultimate market timing model. This model tends to generate only a handful of signals each decade.
The Trend Model is an asset allocation model which applies trend following principles based on the inputs of global stock and commodity price. This model has a shorter time horizon and tends to turn over about 4-6 times a year. In essence, it seeks to answer the question, “Is the trend in the global economy expansion (bullish) or contraction (bearish)?”
My inner trader uses the trading component of the Trend Model to look for changes in the direction of the main Trend Model signal. A bullish Trend Model signal that gets less bullish is a trading “sell” signal. Conversely, a bearish Trend Model signal that gets less bearish is a trading “buy” signal. The history of actual out-of-sample (not backtested) signals of the trading model are shown by the arrows in the chart below. Past trading of the trading model has shown turnover rates of about 200% per month.

The latest signals of each model are as follows:
- Ultimate market timing model: Buy equities
- Trend Model signal: Risk-on
- Trading model: Bearish
Update schedule: I generally update model readings on my site on weekends and tweet mid-week observations at @humblestudent. Subscribers will also receive email notices of any changes in my trading portfolio.
Sell the news?
There has been much written lately about low level of stock market volatility, as measured by the VIX Index. It’s interesting that these concerns have even surfaced in the latest FOMC minutes:
Financial asset prices were little changed since the December meeting. Market participants continued to report substantial uncertainty about potential changes in fiscal, regulatory, and other government policies. Nonetheless, measures of implied volatility of various asset prices remained low.
A little noticed change has occurred in the markets since mid-February. Even though stock prices were grinding upwards, VIX term structure began to steepen as 3-month VIX futures rose but 1-month VIX remained stable. As well, the bottom panel shows that SKEW, which measures the price of tail-risk protection, is rising. These readings indicate that the market is anticipating a near-term volatility event.
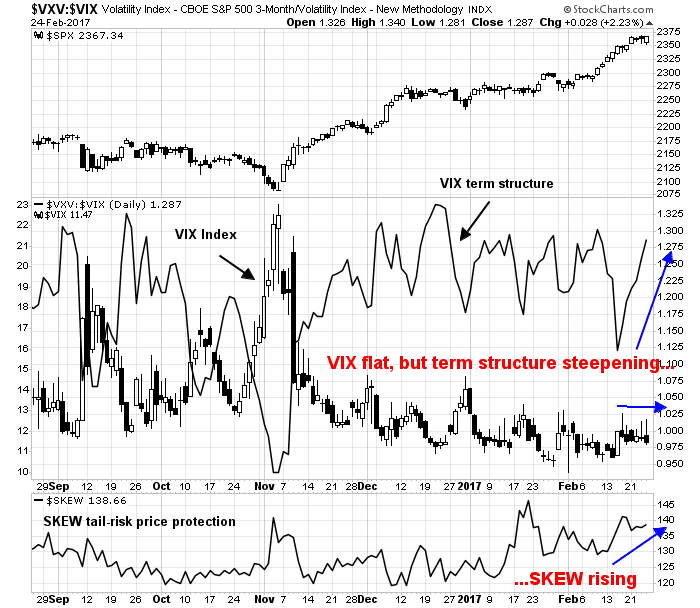
The most likely spark for a volatility event is Trump’s address to Congress on Tuesday, when he is expected to outline his tax reform proposals. This speech has the potential to raise the “uncertainty about potential changes in fiscal, regulatory, and other government policies”.
The stock market has rallied substantially in anticipation of Trump’s proposal of tax cuts, tax holiday for offshore cash repatriation, and deregulation. As Trump’s tax reform proposals become more clear, it is becoming evident that there are two likely outcomes. Either Wall Street will have to swallow the bitter pill of the protectionist measures of a Border Adjustment Tax (BAT), or they will get delayed and bogged down in Congress.
As the market has bought the rumor of tax cuts, it may now be time to sell the news.
Waiting for tax reform
Here is where we stand right on tax reform. In a recent Reuters interview, here is what Donald Trump said when asked about the prospects for tax cuts and deregulation:
“We’re going to have a corporate tax cut … anywhere from 15 to 20 percent (as a target for the corporate tax rate). … We’re going to have other things that are very good and we’re going to have a tremendous regulatory cut because the regulations are piled up on top of each other and you’ll have many regulations for the same thing within different industries and it’s out of control. The regulations in this country are out of control. And it makes it hard for businesses to even open in the United States. We’re going to get rid of a lot of the unnecessary regulations.”
That’s the good news. The bad news is they will likely be accompanied by a BAT as a way to pay for the tax cuts:
“It could lead to a lot more jobs in the United States. … I certainly support a form of tax on the border because everybody else does. We’re the only country, we’re one of the very few countries, possibly the only country, that has no border tax. And that’s not a tax to the consumer, because that’s going to be a tax to companies and it’s going to be a tax to other countries much more so than it is to the consumer. That’s a tax to other countries. And what will happen is, don’t forget there is no tax if we make our product in the United States. So I don’t consider it a tax. That’s a tax if companies are buying their product outside of the United States. But … if they make their product in the United States, there is no tax. So what is going to happen is companies are going to come back here, they’re going to build their factories and they’re going to create a lot of jobs and there’s no tax.”
For readers who are unfamiliar with the BAT concept, here is a discussion of BAT from market analyst and Texas Republican John Mauldin:
Under the BAT plan, imports will be penalized and exports rewarded, which, theoretically, in a perfect world without pushback, would leave our economy nicely balanced and undisrupted. That’s the idea. But I doubt it will happen that way, because the importers and exporters are not the same businesses.
A vast number of businesses import products from other countries and sell them to Americans. Toy companies are a good example. Virtually all the shiny presents under your Christmas tree were made outside the US. The companies that import them could be border-adjusted right out of business under the Better Way plan.
Here’s an example. Suppose you are a toy company and you spend $1 million to bring in toys from China. You package and distribute them to retailers around the country, generating an additional $500,000 in costs for yourself. You sell them at wholesale for $2 million. What’s the tax consequence?
You just spent $1.5 million to generate $2 million in revenue. But the $1 million you spent on the imports is no longer deductible on your tax return. So your taxable profit isn’t $500,000, it’s $1.5 million. At 20%, your corporate income tax is $300,000 instead of $100,000. This plan triples your taxes…
At best there will be an adjustment period, which will be far longer than those who propose this plan think, as workers retrain for new jobs. We’ve heard this story before, and it didn’t work out as advertised. So count me skeptical.
The problem is that the importers and exporters don’t all operate in the same states and counties, so the people who lose their jobs because of the import tax will end up having to move to where the exporting jobs are. How did that work out for the Rust Belt when the steel jobs left? For whatever reason, the data clearly shows we are moving less than we ever have before.
Liberty Street Economics, a blog run by the New York Fed, which believes that a BAT is unlikely to substantially promote exports:
How will U.S. exporters fare? An unintended consequence of the proposed border tax is that it is likely to depress rather than stimulate exports. As export prices are also invoiced in U.S. dollars, the tax exemption on export revenue will mostly boost exporters’ profit margins rather than increase their export sales. And with the accompanying partial appreciation in the U.S. dollar, the prices of U.S. exports in foreign currencies will rise. This will provide incentives for our trading partners to switch their demand away from U.S.-produced goods, resulting in lower U.S. export sales.
Those are just the first order effects. John Mauldin thinks that a BAT will set off a global trade war:
When you talk to Republican leaders and ask them why other countries wouldn’t react to the BAT and impose larger tariffs or sanctions on US goods, they respond with a question of their own; and it’s a logical one: “But why would they? We’re only doing with the BAT what they’re already doing to us.” And they are correct. US corporations are at a massive competitive disadvantage today because we have high corporate taxes and no VAT. Other nations do not charge a VAT tax when their companies export products. That means a German car sold in Asia or a Japanese car sold in Europe has a competitive tax advantage over a car made in the US and on sale in those countries. The Republicans are simply trying to rectify that competitive disadvantage.
The problem is that other countries are simply not going to say, “Oh, the United States finally figured it out that we were taking advantage of its silly, complicated tax system. There’s really nothing we can do, so let’s just get on with the program.” No, they are going to protect their own businesses. In international trade, it’s every country for itself. They are all going to react to losing anything that they think is a competitive advantage. If you don’t get this, go back to kindergarten and study children trading toys in their sandbox. This behavior is ingrained in every human being.
Mauldin concluded (remember, he is a long-time Texas Republican):
I know this is going to offend a few of my friends, but I’m going to say it anyway: I am afraid that this border adjustment tax, if implemented, will throw the world into a global recession. All of the wonderful tax cuts and beautiful plans that are being proposed along with the BAT will not be enough to keep the US from participating in that recession as well.
Understand, I’m a believer in free markets, and I know that the American enterprise and entrepreneurial system, when given an opportunity, can respond and create growth in this country. But the BAT is not the way to do it.
That’s just the pushback from the “moderate” wing of the GOP. Here is an example of the opposition to BAT from the right wing of the party (via Breibart):
The latest solution from GOP “leadership” grab bag of bad ideas is the ill-conceived proposal to “help” America with her huge ($491 billion) global trade deficit with the Border Adjustment Tax (BAT).
The idea goes like this: The U.S. will tax all imports at 20 percent and provide a rebate of 20 percent on American exports sold abroad. That is not only counterproductive from a trade deficit reduction standpoint; it is skewed to help large American corporations over small and mid-sized American producers…
The solution is the scaled tariff. The tariff looks at the trailing twelve months (TTM) of trade balance between other nations and the United States. The tariff would only be applied to countries that have a significant or chronic surplus with the United States. The tariff would be adjusted quarterly up or down based upon the (TTM) figures. As trade heads toward balance, the tariff will self-adjust downward for that country. If a trading partner retaliates with counter-tariffs or currency manipulation that drive a greater deficit, the tariff will rise in direct relation to the (TTM) figures.
Any BAT will be a bitter pill for the equity market to swallow in order to get its tax cuts. A scaled tariff will even be worse.
Legislative chaos
The other likely scenario is a delay of the tax reform as it gets bogged down in Congress. The Hill reported that Ryan’s tax reform plan won’t get more than ten votes in the Senate:
Sen. Lindsey Graham (R-S.C.) says the House GOP tax plan that Speaker Paul Ryan (R-Wis.) tried to sell to Senate Republicans won’t get 10 votes in the upper chamber.
If Graham is correct, it’ll be a blow for Ryan and House Ways and Means Committee Chairman Kevin Brady (R-Texas), who are pushing a 20 percent across-the-board tax increase on imports to pay for comprehensive tax reform.
The idea has run into staunch resistance in the Senate, which bodes ill for President Trump’s hopes of passing tax reform this year.
The Trump administration is still not fully staffed, which is going to slow down its legislative agenda. Business Insider reported that Trump will delay its proposals for infrastructure spending to next year’s legislative calendar. In addition, AP (via Business Insider) reported that the Trump administration also faces a looming debt ceiling fight and possible government shutdown this spring:
Add a potential government shutdown to embattled President Donald Trump’s growing roster of headaches.
Beneath the capital’s radar looms a vexing problem — a catchall spending package that is likely to top $1 trillion and could get embroiled in the politics of building Trump’s wall at the US-Mexico border and a budget-busting Pentagon request.
While a shutdown deadline has a few weeks to go, the huge measure looms as an unpleasant reality check for Trump and Republicans controlling Congress.
Despite the big power shift in Washington, the path to success — and averting a shuttering of the government — goes directly through Senate Democrats, whose votes are required to pass the measure. And any measure that satisfies Democrats and their new leader, Sen. Chuck Schumer of New York, is sure to alienate tea party Republicans. Trump’s determination to build his wall on the US-Mexico border faces a fight with Democrats, too.
In effect, the market is faced with the unpalatable choice of BAT, or a delay of expected tax cuts until next year, with no idea of how the water down the proposals will be.
Good news, and bad news
If investors had bought the rumor of the tax cuts, does that mean that they should now sell the news?
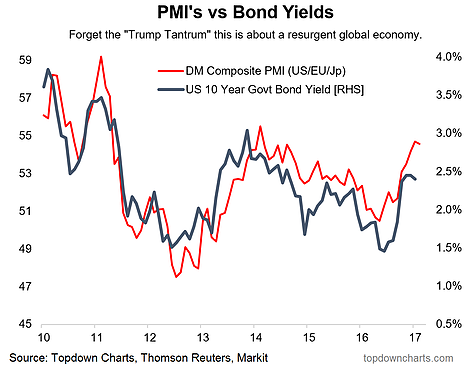
Before making a decision on that question, there is some good news and bad news about the market. Here is the good news. The market rally was sparked mainly by a reflationary growth rebound. As these charts from Callum Thomas of Topdown Charts show, the rebound is broad and global in scope.
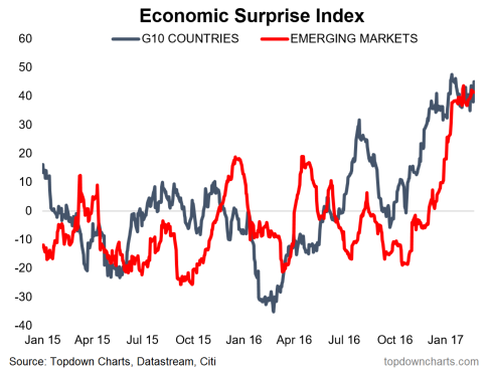
There has also been a surge in global Economic Surprise Indices, which measure whether top-down economic indicators are beating or missing expectations.
Specific to the US, the Chemical Activity Barometer, which leads industrial production, is also rising strongly (via Calculated Risk):
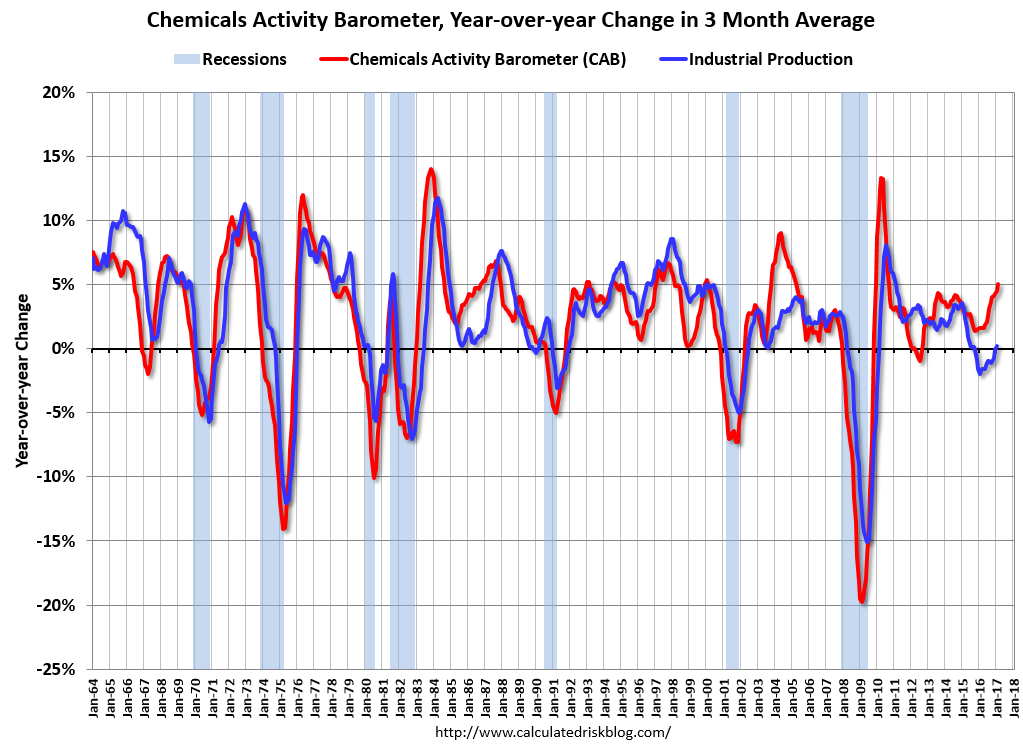
The good news is global macro momentum is pointed upwards.
As good as it gets?
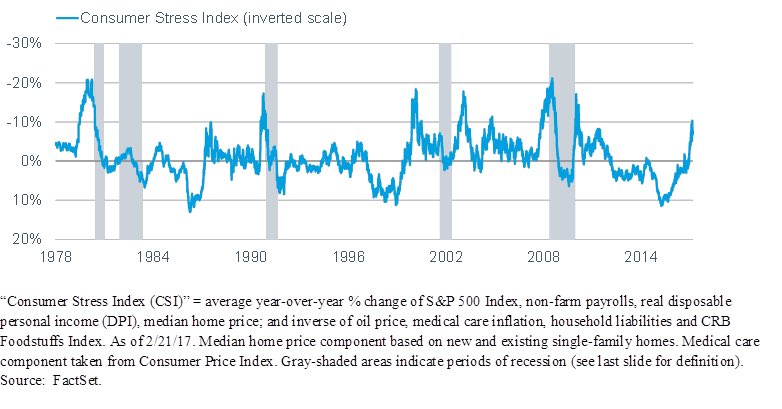
The bad news is conditions may be as good as they get. Liz Ann Sonders observed that consumer stress is rising. While readings are not at danger levels, it does hint at a loss of positive momentum.
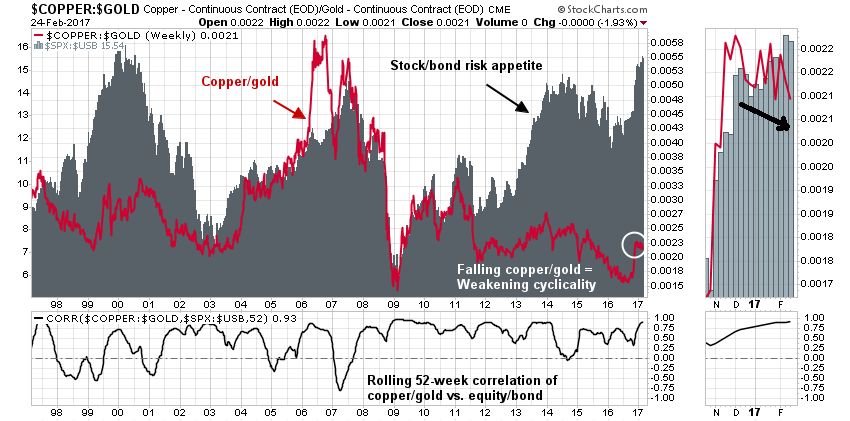
Copper prices, which is an indicator of the global cycle, are starting to weaken. The chart below shows the copper/gold ratio (red line) and the equity/bond ratio (grey bars). While both copper and gold are hard assets, copper has a greater cyclical element and therefore the copper/gold ratio is a sensitive barometer of global cyclical demand. The stock/bond ratio is a measure of market risk appetite, and it has historically been highly correlated to the copper/gold ratio (bottom panel).
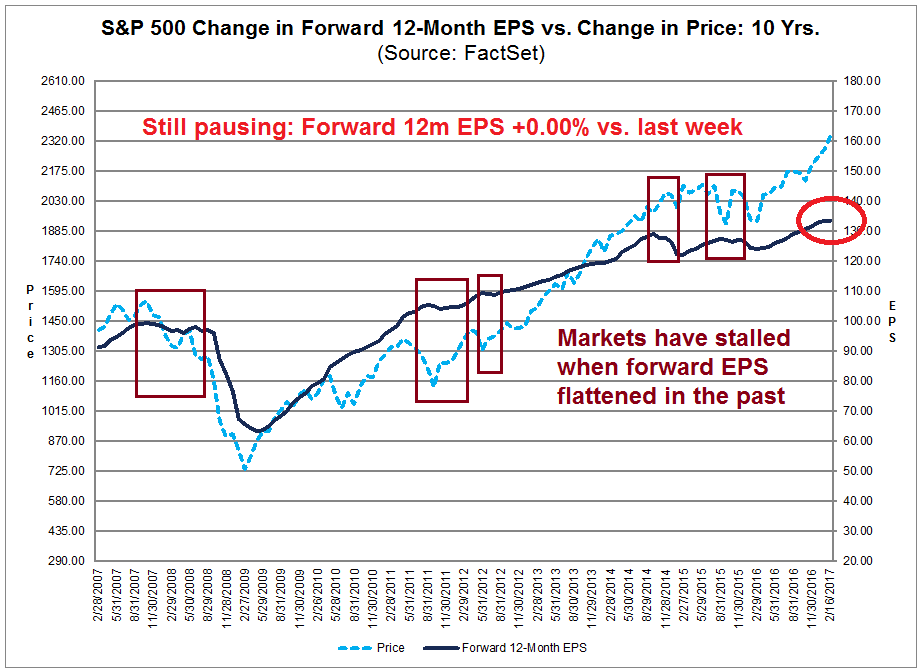
The latest update from Factset shows another sign of stalling momentum Forward 12-month EPS was flat compared to last week and fell compared to two and four weeks ago (annotations are mine).
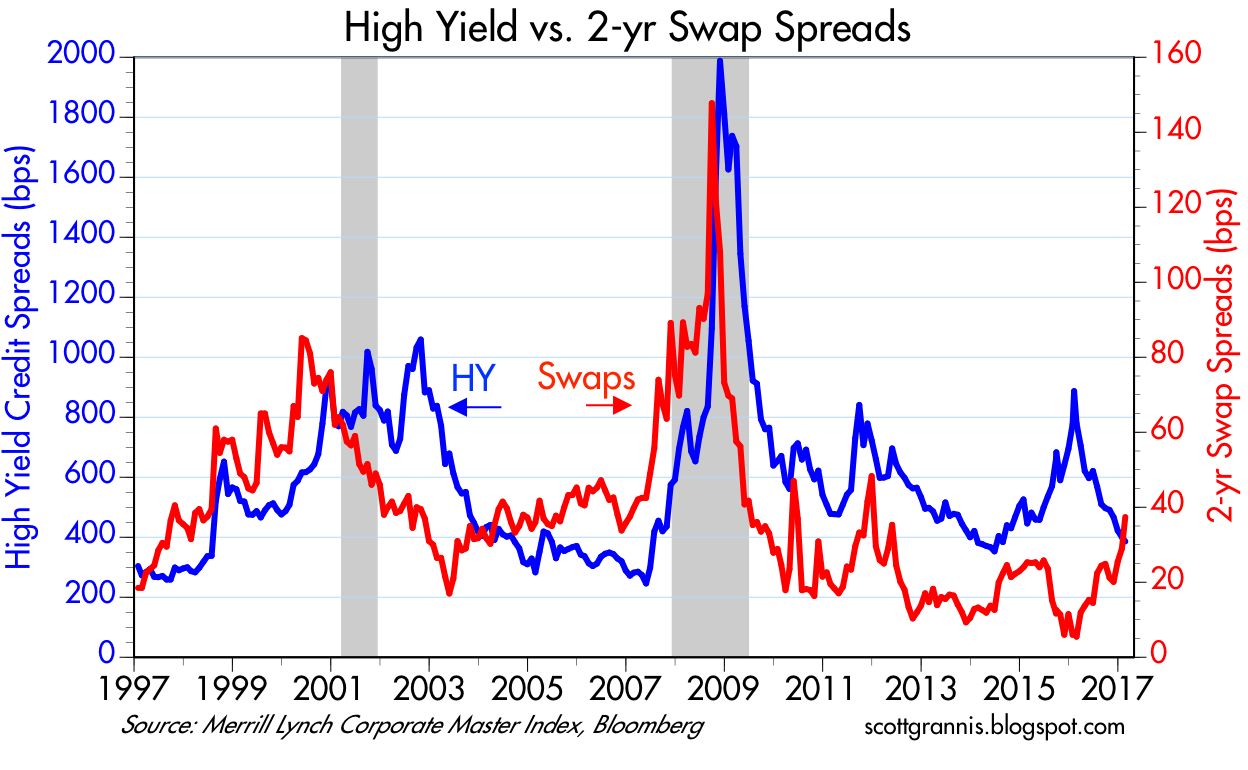
Scott Grannis also pointed out that the 2-year swap rate is starting to rise, indicating higher stress levels. Again, these are not panic levels, but this is another warning sign of declining risk appetite.
What’s more, global macro hedge funds are all-in on their risk exposure.
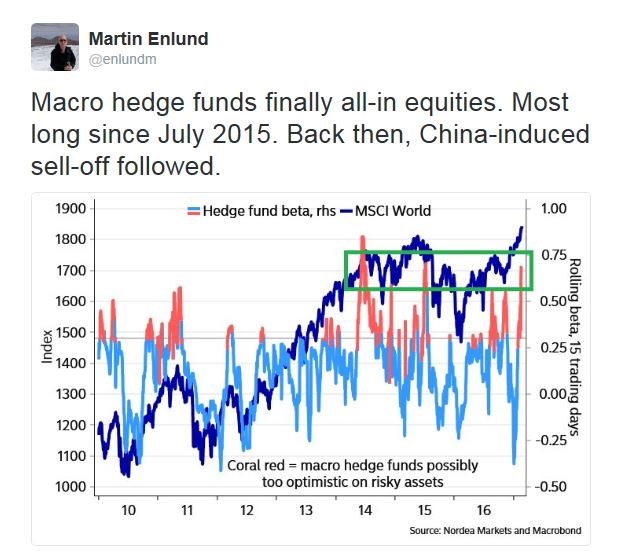
Bloomberg reported that analysis by Novus Partners showed that equity holdings favored by hedge funds are showing low levels of liquidity. So what happens if we get a “volatility event” and they all try to head for the exit?

Is it any wonder why demand for tail-risk protection is rising?
Estimating downside risk
I believe that the prudent course of action for investors would be to prepare for some near-term equity weakness. In that case, the question the becomes, “What’s the downside risk?”
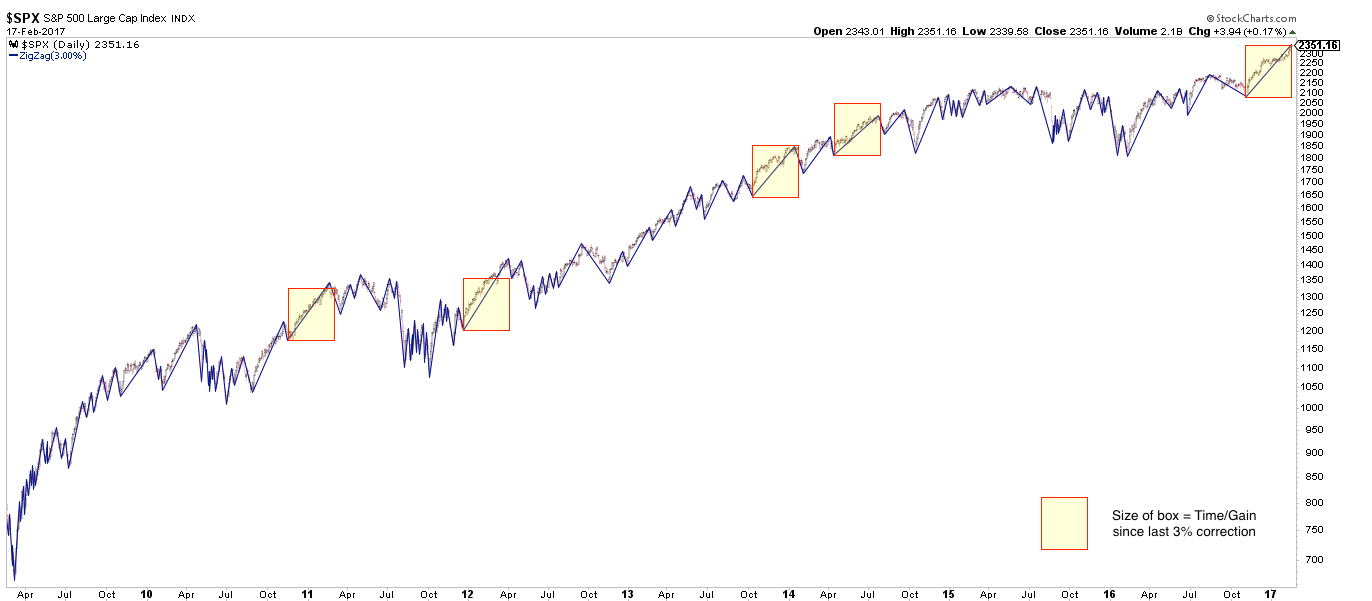
I offer a number of scenarios to answer that question. Urban Carmel pointed out that, from a technical perspective, the stock market has exhibited a period of strong positive momentum. Such episodes tend to resolve themselves with only minor pullbacks before powering higher:
When the current uptrend ends, it is not likely to lead directly into a more significant downturn. Momentum like this weakens before it reverses. In each of the cases highlighted above, after a 3-5% drawdown, SPX either continued higher or retested the prior high before falling lower. Mid-2011, 2012 and 2014 are recent examples of the latter case (shown below). That would be our expectation now as well.
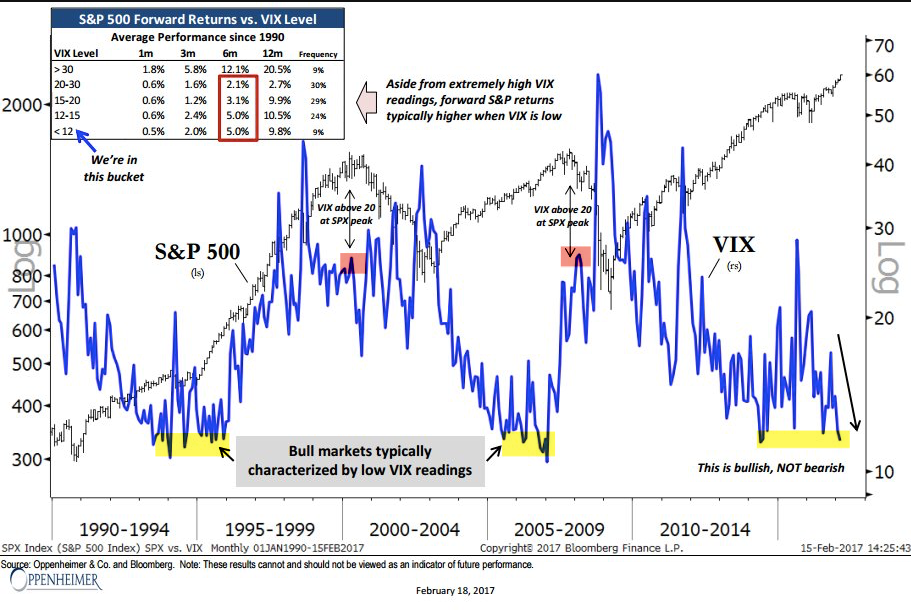
He also highlighted research from Ari Wald, indicating that low VIX levels tend to be bullish market environments, not bearish:
Much has been made of the persistently low level of the Vix. The three most recent bull markets have each been characterized by a persistently low Vix. Historical instances are severely limited, but a low Vix has been a positive sign for the SPX. The market did not peak in either 2000 or 2007 until Vix had climbed, over the course of years, to more than 25. Since 1990, when the Vix has been below 12, SPX has returned 5% and 10% over the next 6 and 12 months, respectively (from Ari Wald).
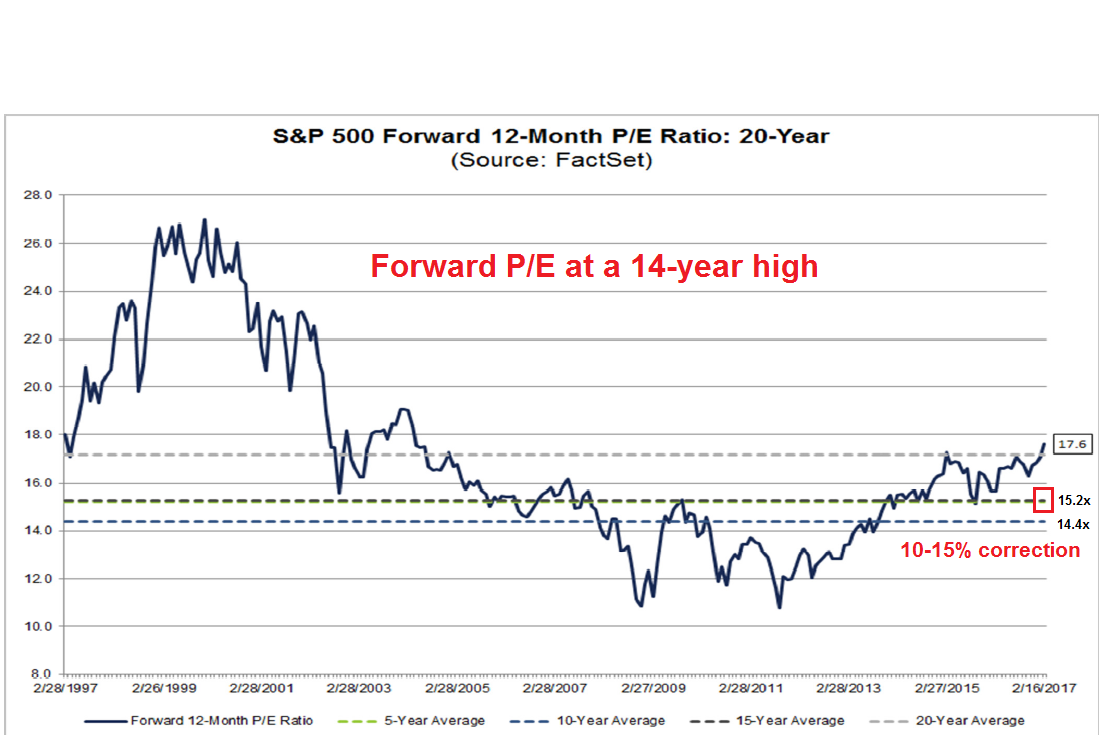
The fundamental answer to the downside risk question depends on how the tax reform measures get resolved. If the tax cuts were to be delayed until next year, then forward P/E ratios may have to adjust downwards. Analysis from Factset shows the forward P/E ratio at 17.6, a 14-year high. Forward P/E is well above its 5-year average of of 15.2 and 10-year average of 14.4. If the global reflation story were to remain intact, a 10-15% retreat in prices would represent a valuation floor for equity risk. I would add, however, that 10-15% represents the probable maximum downside potential, but any pullback could stop well short of that estimate.
Confused? The following SPX chart offers some technical perspective. There is initial support at about the 2280 breakout point, which roughly coincides with the 50 day moving average (dma). Secondary support is at 2190, which also coincides with the 200 dma. If those support levels break, then long-term support can be found at 2135, which corresponds to about a 10% pullback. Viewed view a technical prism, a 10-15% pullback seems unlikely, unless total panic were to set in.

If, on the other hand, tax reforms were to pass with a BAT, then it could signal the start of a major bear market. As the chart below shows, global PMIs are closely correlated with global trade. Both have been rising strongly. Imagine the global macro conditions and growth outlook if trade flows were to tank. Earnings estimates would also fall, and would likely spark a major bear market, tax.

The week ahead: Waiting for the bearish break
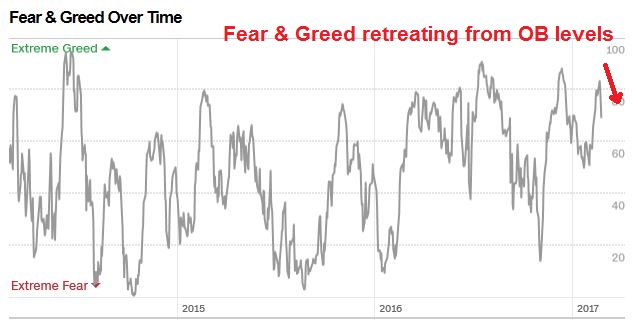
Looking to the week ahead, my inner trader continues to wait for the break in the equity market uptrend. While many technical and sentiment indicators are in the bearish zone, there is no obvious bearish trigger.
The Fear and Greed Index is starting to retreat from overbought levels:
The latest update from Barron’s shows that insiders have resumed their heavy selling.
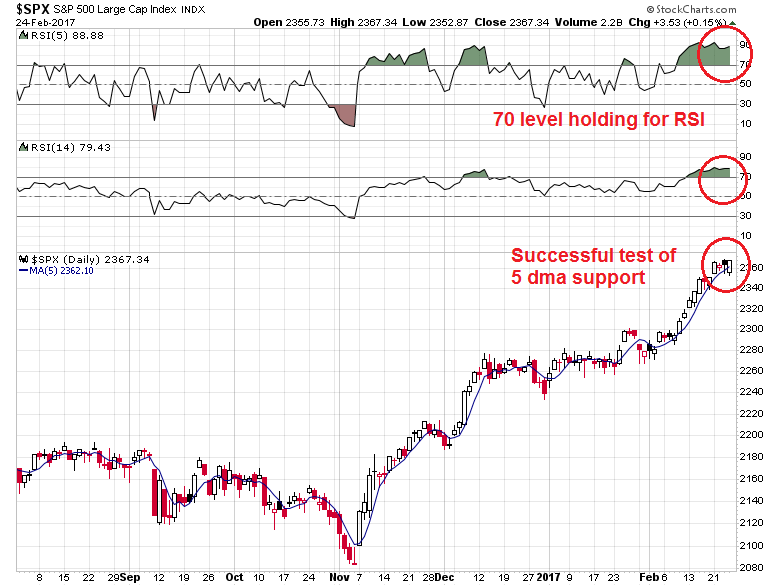
While these technical indicators are supportive of the near-term bear case, we haven’t seen technical breaks of the uptrend that marks a bearish break. Neither the SPX has fallen below its 5 day moving average, nor has its RSI-5 or RSI-14 have declined below the overbought reading of 70.
My inner investor remains constructive on stocks. He is not worried about 5-10% price squiggles when he invests in equities. On the other hand, he will take action to de-risk his portfolio should the more dire scenario of a trade war come to pass.
My inner trader remains in cash. He is still waiting for a technical break before he shorts the market.