I have had a number of discussions with subscribers asking for more “how to” posts (see Teaching my readers how to fish). This will be one of a series of occasional posts on how to build a robust investment process.
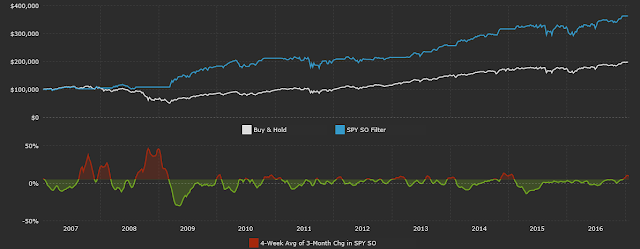
For traders and investors, one of the challenges is how to build a robust discipline that works well through different market regimes. As a case study, consider this study from Simple Stock Model that generates signals based on the cash flows in and out of the SPY ETF as a sentiment signal. The trading rule is: “If the 4-week average of the 3-month change in SPY’s percentage of shares outstanding is greater than +5%, be out of the market.”
The chart below shows the equity curve from this trading system (white line = buy and hold, blue line = trading system). The results look pretty good, especially for a relatively low turnover model. (Incidentally, it’s on a sell signal right now).
Not so fast! Don’t jump to conclusions before digging into the data and reading the fine print.
One big call
If you look at the details of the equity curve, you will see that the trading system made its money by avoiding the devastating bear market of 2008-09, but the market kept rising when it flash its other “sell” signals. If we were to restart the equity curve from the time this trading system flashed the all-clear buy signal after the 2008-09 bear market, it underperformed its buy-and-hold benchmark.
This is the first lesson. Evaluate the success rate, or batting average, of any trading system to see if the results are acceptable. In some cases, you may decide that a system with a low success rate with outsized gains is acceptable – just be aware of its characteristics and manage your risk properly.
Asymmetric signals
This trading model is a sentiment model and I used it as an example to illustrate another point. The market response to model readings don’t always behave the same way at buy and sell extremes. Model signals can be asymmetric, especially for sentiment models.
Consider this chart of NAAIM exposure, which measures the sentiment of professional RIAs. In this example, I have arbitrarily set the trading rule to buy when the NAAIM exposure falls below 20 and to sell when it rises above 95. The “buy” signals are marked with blue vertical lines and the “sell” signals are marked with red lines. As the chart shows, the “buy” signals have tended to be pretty good, as they have tended to mark panic market bottoms. On the other hand, “sell” signals, which indicate complacency, have been less than effective.
As these are backtested results, it could be argued that when I set the buy and sell signals at 20 and 95 respectively, I was torturing the data until it talked. As an alternative, I set the buy and sell signals when the NAAIM exposure reading penetrated its 2 standard deviation Bollinger Band with a one-year moving average. The conclusions are similar. Buy signals work much better than sell signals.
That is the second lesson. Measure the effectiveness of both your buy and sell signals. They may not be the same.
In a post next week, I will address some the issues that face the professional and institutional investor.


I have never wrote before on this site, I want to thank you Ken for your comments, it brings additional added value to Cam’s posts. I’m really appreciate that and I’m reading each your comment. Keep going! 🙂