Preface: Explaining our market timing models
We maintain several market timing models, each with differing time horizons. The “Ultimate Market Timing Model” is a long-term market timing model based on the research outlined in our post, Building the ultimate market timing model. This model tends to generate only a handful of signals each decade.
The Trend Model is an asset allocation model which applies trend following principles based on the inputs of global stock and commodity price. This model has a shorter time horizon and tends to turn over about 4-6 times a year. In essence, it seeks to answer the question, “Is the trend in the global economy expansion (bullish) or contraction (bearish)?”
My inner trader uses the trading component of the Trend Model to look for changes in direction of the main Trend Model signal. A bullish Trend Model signal that gets less bullish is a trading “sell” signal. Conversely, a bearish Trend Model signal that gets less bearish is a trading “buy” signal. The history of actual out-of-sample (not backtested) signals of the trading model are shown by the arrows in the chart below. Past trading of the trading model has shown turnover rates of about 200% per month.
The latest signals of each model are as follows:
- Ultimate market timing model: Buy equities
- Trend Model signal: Risk-on
- Trading model: Bullish
Update schedule: I generally update model readings on my site on weekends and tweet mid-week observations at @humblestudent. Subscribers will also receive email notices of any changes in my trading portfolio.
Trumponomics: The bull case
It’s nearing year-end and prognostication season. Rather than just gaze into my crystal ball and make a forecast for 2017, I will write a two-part series on the likely effects of the new president on the stock market. This week, I focus on the bull case.
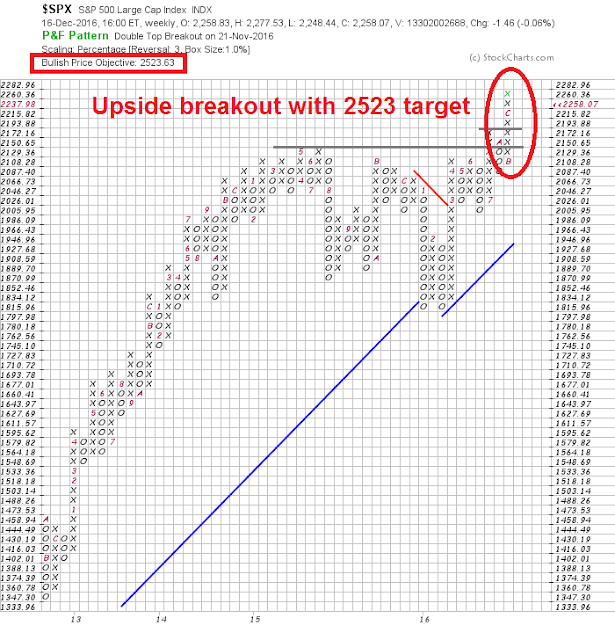
Since the recent upside breakout, point and figure charting is pointing to a SPX upside target of 2523, which represents a gain of 11.7% from Friday`s close. I show how that figure is easily achievable under the Trump proposals – and more.
Earnings, earnings, earnings!
The bull case for stocks rests mainly on earnings growth. There are three components of earnings growth that investors should focus on:
- Organic growth, in the absence of Trumponomics
- Tax cut effects
- One-time offshore cash repatriation effects
If we start with organic EPS growth, the November 4 pre-election bottom-up Street estimates from Factset showed a forecast of $119.47 for FY2016 SPX and $113.68 for FY2017, which comes to an earnings growth rate of 11.8%. The latest Factset consensus estimates in the post-Trump era also shows an identical EPS growth of 11.8%, which indicates that company analysts have not incorporated the unknown effects of Trump’s fiscal proposals into their earnings estimates.
However, I would caution that these EPS growth estimates need to be taken with a grain of salt. Ed Yardeni showed that bottom-up derived Street EPS forecasts tend to start high and fall. That`s why I focus on the evolution of forward 12-month EPS, which is more stable.
So let`s be conservative and cut that growth figure by somewhere between one-third and one-half. We arrive at an organic EPS growth rate of about 6-8%.
On top of that, we can add the tax cut effect of the Trump fiscal proposals. Bloomberg recently summarized the tax cut earnings effect of different Street strategists. The growth projections vary, but come to about 10%:
- Deutsche: $10 (8.4% EPS growth), based on a tax cut to a rate of 25%
- JPM: $15 (12.6% growth), based on a 15% tax rate
- Citi $12 (9.3% growth), based on a 20% tax rate (via CNBC)
Add the 10% tax cut effect to the organic EPS 6-8% growth rate, we get to a 2017 EPS growth rate of 15-18%. In the absence of changes in P/E multiples, the SPX could therefore rise 15-18%, in line with earnings growth. That gives us a 2017 year-end projection in the 2600-2650 range, which is above the point and figure chart target of 2523.
That’s not all, Brian Gilmartin recently took a stab at estimating the offshore cash repatriation effect:
Yesterday, 12/6/16, at the CFA Chicago luncheon, Dan Clifton of Strategas Partners gave a great presentation on the coming fiscal stimulus and what it might look like and what it might mean for the US economy in 2017.
The inevitable question about cash repatriation came up and Dan gave a lengthy and thoughtful response, but he eventually got down to the numbers: Dan thought that as much as $1 trillion could be brought back to the US as repatriated cash, and granted investors will hear the standard hue-and-cry about using the repatriated cash to repurchase stock, Clifton thought that $300 – $400 billion of the repatriated cash could be spent directly on buybacks.
Looking at the numbers:
- The current market cap of the SP 500 is roughly $19 trillion, so roughly 5% of the SP 500 market cap could be repatriated;
- In terms of the “index divisor” (per Thomson Reuters data) there are 8.6386 billion shares used in the SP 500 EPS calculation.
- Using Clifton’s numbers, if $300 – $400 billion of the $1 trillion is used directly on shares repurchases, then roughly 1.5%, 2%, 2.5% of the SP 500’s market cap could be repurchased JUST from overseas cash repatriation in 2017.
This obviously doesn’t include any cash generated from a reduction in effective tax rates, faster revenue growth or cash generated normally from operations, resulting in free-cash-flow.
Let`s summarize the results. Start with a 15-18% increase in stock prices, which assumes no changes in P/E multiples. Add to that an estimated buyback demand amounting to roughly 5% of total market cap, you have the bull case for stocks. As Brian Gilmartin put it:
In year-end meetings with clients, I’m telling clients from both sides of the aisle that the SP 500 could be up 20% next year. Prior to the election and since last Spring ’16, the SP 500 was already looking at its best year of expected earnings growth in 5 years. The proposed President-elect and Congressional fiscal policy could be another level of earnings growth above what was already built into the numbers, before November 8th.
Any way you slice it, the upside potential for US equities in 2017 easily comes in at 15-20%.
The big money stampede
While the fundamental outlook appears to be positive, no equity rally is sustainable without the participation of the big money institutions. The latest BAML Fund Manager Survey shows that the institutional risk appetite is rising in a big way.
They believe that global growth is returning. Growth expectations have spiked significantly in the last few months.
As a consequence, earnings expectations have also risen dramatically too.
In response to this newly upbeat assessment, institutions are taking more risk with their portfolios. Readings are rising, but nowhere near crowded long levels.
They are buying equities.
US equity exposure is rising, but they are not over-owned.
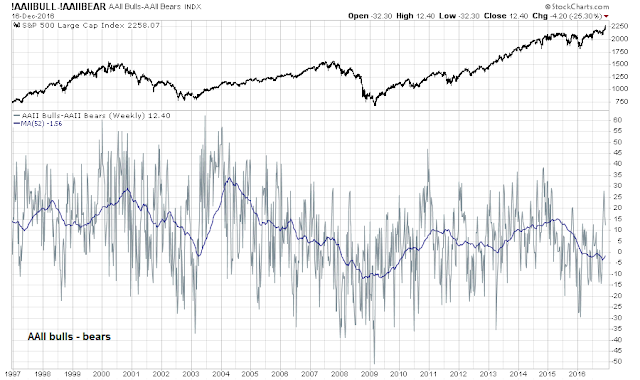
Similarly, the AAII sentiment survey of individual investors can hardly be described as being all-in on stocks.
In summary, sentiment models show that investors are piling into risky assets, but the stampede is just in its early stages. There is still time to jump on the bandwagon.
Valuation not excessive
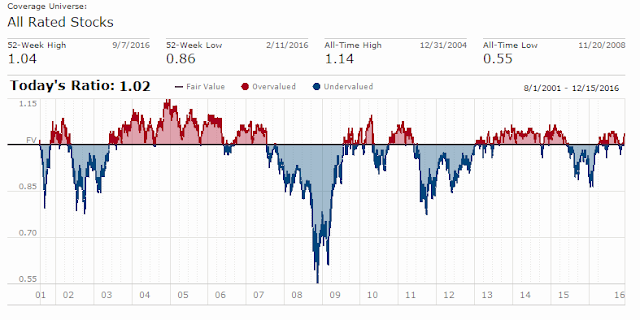
What about valuation? Stock prices appear to be highly overvalued on CAPE, but Michael Batnick pointed out that the CAPE is a terrible metric for short-term market timing: “Over the past 25 years, the CAPE ratio has been above its historical average 95% of the time. Stocks have been below their historical average just 16 out of the last 309 months. Since that time, the total return on the SP 500 is over 925%”.
By contrast, the Morningstar fair value estimate shows that stock prices are mildly overvalued by 4%, but that’s not excessive compared to its own history.
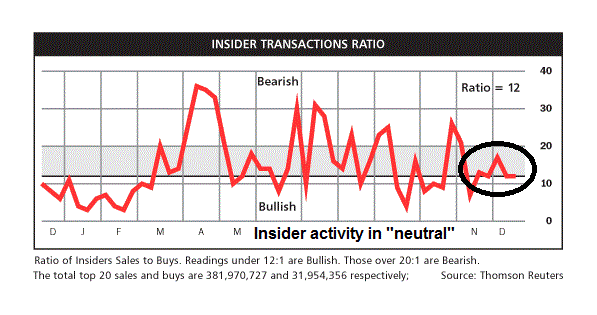
I would be far more worried if insiders were consistently selling in an overvalued market. The latest update from Barron’s of insider activity shows that insider activity at a neutral level, despite the proximity of all-time highs in stock prices.
The week ahead: Will Santa show up?
Looking to the week ahead, the Santa Claus rally may be just getting ready to get rolling. Now that the equity market has successfully navigated the hawkish FOMC rate hike, the seasonal pattern is highly favorable. Rob Hanna at Quantifiable Edges observed that stock prices tend to rise and continue rising starting December option expiry (OpEx) week, which began last Monday.
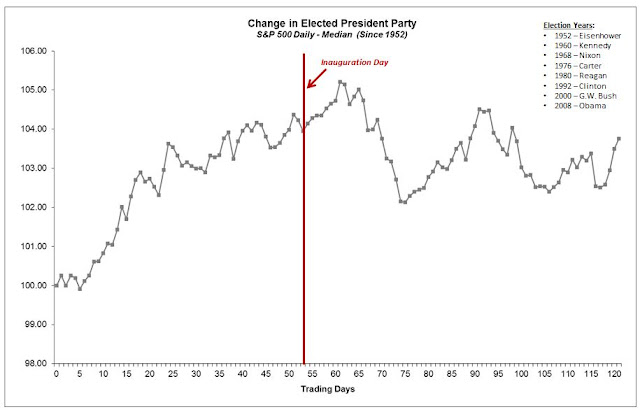
In addition, the electoral pattern shows that stock prices tend to have an upward bias and peaks out just after Inauguration Day.
My inner investor remains bullish on stocks. My inner trader is positioning himself for the seasonal rally. Subscribers received an email notice last Thursday indicating that my inner trader had added to his long equity exposure with a purchase of small cap stocks.
Unless something earth shattering happens in the markets next week, postings will be light or nonexistent as I take a week off during the holidays. The next scheduled update will be on Monday, December 26 when I outline my Trumponomics bear case for stocks, and how I resolve the bull and bear scenarios.
Disclosure: Long SPXL, TNA



Happy Holidays Cam!
Another great write up. I follow a few paid analysts and this is the most rational, comprehensive and historically performant analysis out there.
As promised I have built some charts with prices rebased to the Trump election AND the Fed hike day last week. It will be important to monitor industry, country and style leadership going forward. Last year after the Fed hike in December 2015, everyone thought rates would soar but instead within a couple of weeks bond interest rates did the opposite and started falling like a rock. Market leadership totally surprised forecasters as well.
This year again, we are expecting rates to rise. The Fed Dot Plot calls for three hikes, one more than expected a few months ago. Leadership is with those sectors like banks that benefit from higher rates and a stronger economy with Trump policies promised. I’ll be watching the charts to see if current Trump winners keep leading post-Fed hike.
This chart is of major global and U.S. indexes post the Trump election date PLUS the Fed hike date. Click on it to open. If you copy and paste it or any of the other charts, somewhere you can refer to it any day in the future. It is dynamically linked and updates daily.
https://product.datastream.com/dscharting/gateway.aspx?guid=bb291bb1-a300-4e45-8378-69e014256c5d&action=REFRESH
This chart has the Trump major industry group winners
https://product.datastream.com/dscharting/gateway.aspx?guid=25be6f35-98a9-41a1-8f0b-298960e44b20&action=REFRESH
This chart has the Trump major industry group losers.
https://product.datastream.com/dscharting/gateway.aspx?guid=d200b018-ad6e-4215-907d-df95764cbed1&action=REFRESH
This chart has interesting Trump industry subgroup winners
https://product.datastream.com/dscharting/gateway.aspx?guid=aee2de60-f4e6-485e-9596-5de690f3078a&action=REFRESH
This one has Style performance post election and post Fed hike.
https://product.datastream.com/dscharting/gateway.aspx?guid=1f2e2da4-d00e-449c-84c0-c14182bad728&action=REFRESH
My success with managing my clients portfolios is mainly using momentum investing in winning industry and country ETFs. I identify outperformers and own them until they start underperforming the market.
A key improvement in my strategy was to detect if a new trend was starting and getting on board if it made sense. That allows me to buy an underperforming group such as the Bank ETF when Trump was elected. A strict momentum investor would have to wait months for the Bank ETF to finally outperform the market for the six months or a year required in momentum theory. This is a flaw in momentum theory that I have hopefully cured.
This ability to buy a deeply depressed underperforming sector also allowed me to pivot to energy, mining and dividend ETFs in January when they made an important long term bottom. Cam’s work on pinpointing the energy sector bottom was a big help then.
These significant turning points for underperformers doesn’t happen often, maybe every few years. That we had two this year with the surprise Trump victory plus the commodity turnaround in January, is extremely rare. I expect we will be in normal momentum mode for the next few years. That means not trying to pick the bottom on anything that is underperforming. Momentum theory says trends persist. I respect that.
Ken,
Thank you so much for your hard work generating those charts and sharing with the group. I for one really appreciate it, as I am sure many others do as well.
Thanks again for your good contributions to the blog. Happy Holidays to you.
Cam,
Thank you, as always, in making it clear that your blog is more than worth the yearly membership by 1000 folds. I love the concise and thoughtful postings. I am certainly “learning how to fish”. =)
Happy Holidays to you!!!
–Mohit
Thanks Mohit. We are in this thing together.
All the best in the holiday season.
Ken
Thanks a thousand times to Cam for a great service, and for the highly useful learning experience!
And Ken: thank you so much for the lovely links.
Cam: Any thoughts on what repatriating $1T in US dollar deposits from overseas banks might do to already very shaky Chinese, EM, and European banking systems? Thanks.
My guess is that these monies were not kept on deposit at a bank but rather invested in government short term paper. Apple for example with its hundreds of billions in Ireland could buy U.S. treasury bills or bonds in an Irish based investment account.
I agree with Ken. Most of the offshore corporate funds were invested in USD denominated short-term paper. However, repatriation of those funds will lead to an offshore USD shortage, which will have the effect of tightening credit conditions in the offshore USD market and therefore raise the systemic risk level.
Really appreciate Cam’s good work and Ken’s sharing. Wish both of you happy holidays with your family!