Mid-week market update: Two weeks ago, I had forecast a minor stock market pullback as the SPX neared 2200 (see The market catches round number-itis). The corrective move hasn’t happened and remain in a tight trading range. The one bright spot for the bull case is stock prices haven’t fallen in response to bad news, such as the surprising shortfalls in both manufacturing and services ISM in the past week. On the other hand, the tight trading range appears to be encouraging traders to short volatility, which is worrisome.
I’ve become increasingly concerned about a prolonged crowded short reading by large speculators on VIX futures. Here is the chart from Hedgopia.
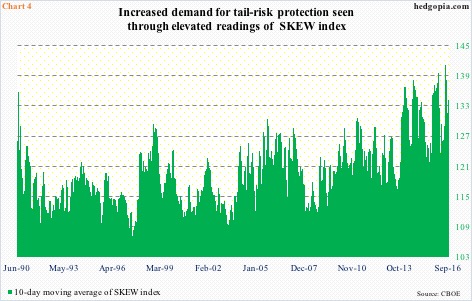
The crowded short position by large speculators is worrisome because it invites a disorderly unwind of the shorts, which would lead to a spike in volatility. As the VIX Index tends to be inversely correlated with equity prices, VIX strength would therefore translate into equity weakness. At the same time, the SKEW Index indicated a heightened appetite for tail-risk protection.
As both my inner investor and inner trader have adopted bullish views, the prolonged period of an extreme net short VIX position was a nagging concern – until I realized the explanation for traders to be short VIX. Using the new analytical framework, these readings did not appear to be equity bearish at all.
An option math primer
Readers who are familiar with the option modeling techniques can skip over this part. For newbies, the VIX Index, which is a measure of volatility, is an input to the Black-Scholes option model. I am not going to get into all the math behind the option model, but there are several key inputs that determine the price of a call option.
- Time to option expiry (longer = higher call option price)
- Risk-free rate (higher rates = higher call option price)
- Difference between current price and exercise price (higher difference of market price – strike price = lower call option price)
- Volatility (higher volatility = higher call option price)
- VXST: 7 day implied volatility
- VIX: 1 month implied volatility
- VXV: 3 month implied volatility
- VXMT: 6 month implied volatility
Term structure arbitrage
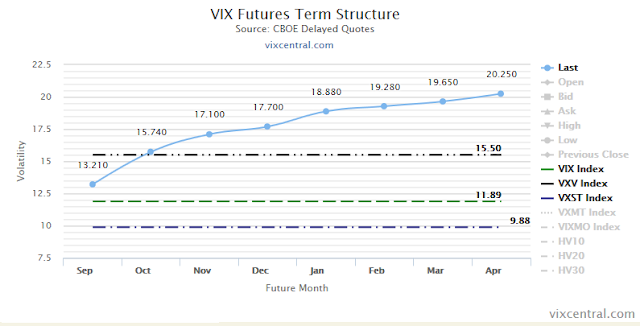
When we observe the chart below of the term structure of implied volatility, we can see that the slope is upward sloping, otherwise known as contango. Under such conditions, a trader could lock in a profit by buying short-dated volatility and then hedge his long with a short position in long dated volatility, such as a VIX futures contract. As long as the steep contango holds and the short dated long positions can be rolled forward at similar rates, a profit can be assured.
Think of these positions are a form of the “carry trade”, but using volatility over different time frames. There is an additional bonus to this kind of volatility term structure arbitrage trade. If realized volatility were to spike because of a stock market sell-off, these positions may not necessarily become unprofitable. Should stock prices fall, VIX term structure usually flattens and sometimes even inverts, with short-dated vol trading above long-dated vol. The profit from the long short-dated vol would likely offset any losses from the short in long-dated vol.
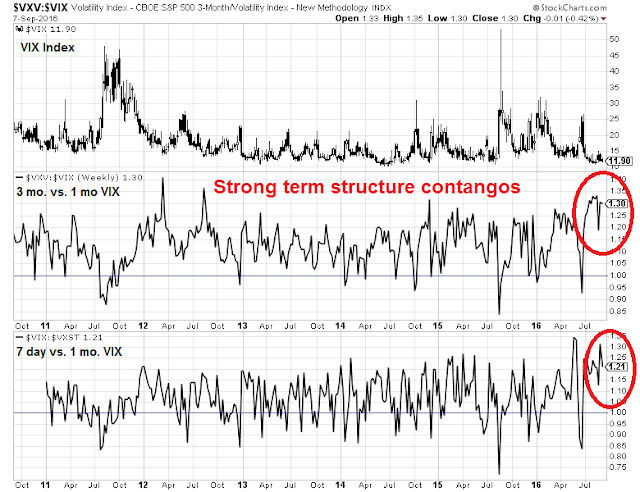
As the chart below shows, the VIX (1 month)/VXST (7 day) ratios and VXV (3 month)/VIX (1 month) ratios are at historically high levels, which makes the volatility term structure arbitrage position that I described very profitable. For example, the 1.21 VIX/VXST ratio shown in the chart indicates that if a trader could hold that long/short position and roll it forward at those pricees until the one-month VIX maturity, he would realize an un-annualized return of 21%. Similarly, the 1.30 VXV/VIX ratio indicates an un-annualized return potential of 30%.
From this point of view, the crowded short in VIX futures makes perfect sense. These positions are not simple bets on falling volatility, but hedged positions. (Hey kids: don’t try this at home. Putting on these kinds of positions involve a higher understanding of option math and tricky position management techniques than what I’ve explained here.)
Mystery solved. There is no crowded VIX short, therefore these readings are not equity bearish.
When does volatility spike?
Notwithstanding the volatility structure arbitrage trade, volatility remains very muted. The chart below from Dana Lyons shows that realized volatility is at all-time lows. When does volatility start to rise again?
There may be trading related reasons why volatility continue to remain low. Rachel Shasha observed that the proliferation of short-dated equity index derivatives may be acting to suppress volatility:
I won’t bore you with too much detail about my option, but a quick note that I believe this is negative for short term traders. I think all these new shorter term derivatives (SPX now expires 3x a week) are partly to blame for the very tight ranges lately. With constant pinning taking place, it seems price always needs panic or FOMO to make any range breaks hold. Furthermore, with high strikes piling up on so many short term vehicles, range expansions (when they finally occur) can have an exaggerated affect due to all the delta heading.
In short, we may need some sort of surprise, such as a surprise on a closely watched macro data point like the Employment Report or a major product announcement from an index heavyweight like AAPL, before volatility can break out to the upside.
Oh wait…
Disclosure: Long SPXL, TNA


I am still mystified as why volatility is so low when there are so much concern about valuation, the fed, elections, Europe. China, trade wars etc.
being short a VIX contract that is longer dated on a steep curve is still a short. Yes there is an edge to realized volatility, but it is still a short. Similar to being short an overvalued asset.
Is being long physical gold or oil and then shorting a gold or oil futures contract against the long position still a “short”? If not, what’s the difference?
Please discuss.
A short is a short, if one has to buy back later. If the person short the future will do physical delivery, then its a hedge, not short.
I do agree, analysts make far too much of this VIX short. Taken in isolation, many CFTC positioning reports would give you a picture that is incorrect. Only cross-market analysis can solve the puzzle. This is the case for most Equity Index futures contracts but also think of Rate Futures where there is a massive 5Yr Note Futures in the Leveraged community : they are not expecting imminent rate hikes, rather they are short %yr vs Corporate Bonds, Credit, Emerging markets.
Low volatility will only become a problem if excessive risk taking follows….
how is the short VIX future investor long the VIX?
Here is one way:
1) Buy a short-dated at-the-money straddle (call and put at the same price) on the S&P 500 using the option series that expire weekly
2) Sell short the VIX futures (but you need to properly calibrate your hedge ratio between your long and short positions)
3) Roll the long position forward as it expires
4) Repeat step 3 until the short position expires
Here is another way that doesn’t involve actually shorting the VIX futures and therefore the hedge ratio is easier to calculate:
1) Buy a short-dated at-the-money straddle (call and put at the same price) on the S&P 500 using the option series that expire weekly
2) Sell short a longer dated straddle
3) Roll the long position forward as it expires
4) Repeat step 3 until the short position expires
I asked Jason Goepfert, editor of sentimentrader.com about this. They often comment about the VIX and have done deep analysis on it. Here is what he emailed me, “In the past, yes, when speculators were extremely short the VIX futures (meaning commercial hedgers were long), the VIX tended to rise. It’s not perfect, like anything else, but I do think it’s a factor. They (speculators) are currently holding an all-time record short position.”
In every commodity contract, players are registered as ‘speculators’ or ‘commercial hedgers’. ‘Speculators’ are small investors whereas the ‘commercial hedgers’ are the big institutions. Right now the big guys (banks, hedge funds, insurance companies, pension funds etc) are VERY long on the other side of the general public VERY short. The big guys are normally right.
It’s good to also remember what VIX is truly measuring. It is the rate of annualized return that one can earn by buying the S&P 500 stocks and writing the at the money S&P 500 calls on all the 500 underlying stocks. In other words a covered write. So a VIX of 12 is like buying the S&P at $100 and selling a $100 call for a dollar. If the index and VIX stays the same for a year you will collect a dollar 12 times and make about 12%.
Now you can see that this is pretty risky. You only get a dollar downside protection or 1% on your $100 invested. That might be okay in tranquil markets but if things start getting wildly gyrating players that write these calls will want more protection but speculators will be will to pay more. So if the S&P was at $100 in a volatile market the $100 call option might be priced at $3 or 3% for a month which calculates out to about a 36 on the VIX (3% times 12 to make it annualized)
In both cases VIX at 12 or VIX at 36, the investors doing the covered writes are expecting that their investment will turn a profit. To turn a profit on a covered write the stock must stay above your investment which is 99 in the case of the VIX at 12 ($100 minus a dollar taken in) or $96 in the case of the VIX at 36 ($100 minus $4). So investors want more downside protection in a volatile market. This extra protection on the rate of return they demand is called “implied volatility”.
short VIX position is against a deliverable VIX via a straddle ? I don’t buy that VIX curve is steep and based on historical volatility there is an edge to being short but I think it is an open short position that will have to be covered if the market dynamics change