Mid-week market update: I like to monitor the option market from a sentiment modeling perspective because, unlike surveys which can swing all over the place, the option market is a forum where people are putting real money on the line.
Even as the stock market has been slowly grinding upwards, the option market has been showing signs of skepticism. As the chart below indicates:
- The market is overbought on RSI-5 and nearing an overbought condition on RSI-14, but…
- The VIX Index, aka the Fear Index, has been rising for the last few days; and
- The VIX term structure has also been indicating higher fear levels in the same time frame.

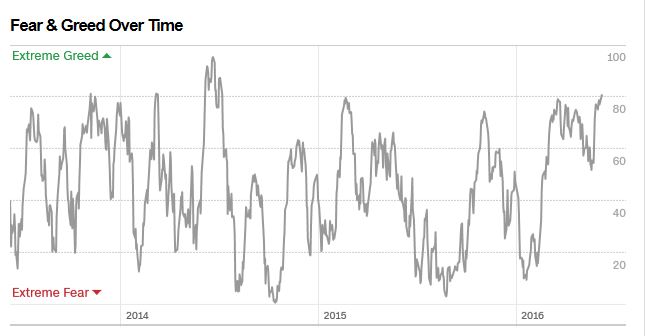
At the same time, standard measures of overbought/oversold and sentiment models, such as the CNN Money Fear and Greed Index, is showing a high level of greed, which is contrarian bearish.
What’s going on? Is this just a sign that the stock market is climbing the proverbial Wall of Worry?
An overbought market
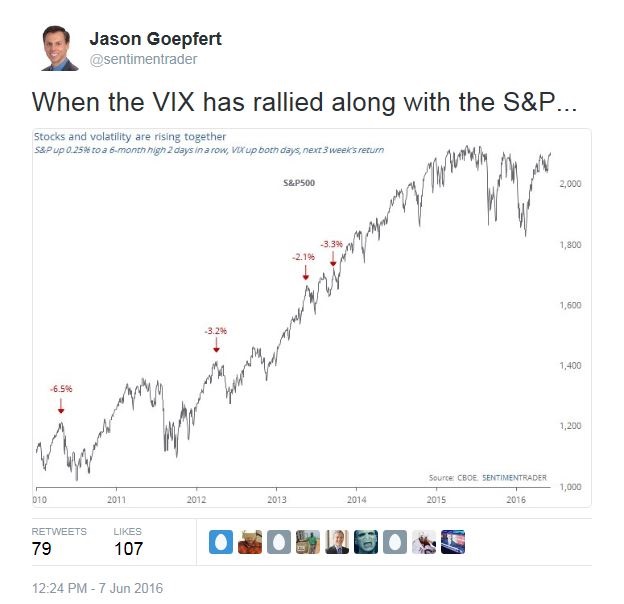
Jason Goepfert recently provided some context to the current movement in the VIX Index. As the chart below shows, the market has tended to pause and pull back after both SPX and VIX have advanced together.
As well, Urban Carmel pointed out that the Fear and Greed Index tends to be a bit early in calling short-term tops, but risk/reward is tilted to the downside.

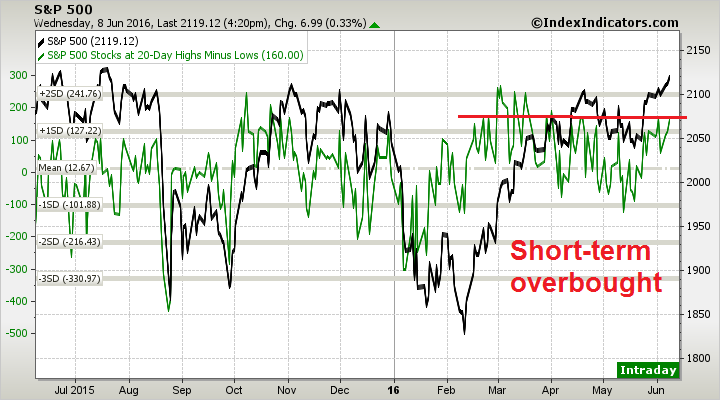
Currently, other short-term measures like this one from IndexIndicators are at overbought levels where pullbacks have occurred.
My inner trader believes that while the stock market can continue to grind a bit higher and possibly make a new all-time high, the prudent course of action is to start scaling out of profitable long positions. At the same time, he will keep tight trailing stop orders on his remaining long SPX longs as he is mindful of the old Wall Street adage: “Bulls make money. Bears make money. Pigs just get slaughtered.”
Disclosure: Long SPXL
Cam, or anyone: Is it known how the CNN Fear & Greed indicator is calculated? What components, and how weighted? If it is just a black box of some sort, it is hard to give it much value unless it has a very long history. Thanks.
Rick,
Try this link. It\s not mathematical, but it gives a sense about how they do it.
http://money.cnn.com/investing/about-fear-greed-tool/index.html
I have studied sentiment extensively and used it successfully over many cycles. When a new bull market starts (and my work says we just started one on February 11), markets stay overbought and when they pull back they only travel halfway back on sentiment indicators before going very overbought again. They swing back and forth in the upper half of the sentiment indicator range. This continues for six to nine months before you get a normal oversold reading. After the March 2009 start to the last bull market, we did not go over sold until March of 2010. After the first leg of the new bull is completed, the market swings normally from intermediate overbought to oversold. When we enter a bear market the ending looks like the opposite of the beginning. The market goes oversold and cannot get back to overbought. It gets halfway back to overbought and stays in the bottom of the range until the bear market ends.
I expect confusion for a while as we see what Cam calls ‘good overbought’ where markets stay up and we are not offered a good pullback to buy at a comfortable oversold purchase price. But this action will be confirmation that a new multi-year bull market has started.
If there is no rate increase at the July Fed meeting, the new ‘lower for longer’ theme will gain more momentum and send any stock with a decent dividend up strongly. Dividend yields on stocks are absurdly generous compared to bonds when you come to believe in a ‘lower for longer’ path of rates. The market action tells me that more investors, especially long term investors are coming around to that viewpoint every day. There is steady, steady buying. There has not been a 1% down day in two months.
Ken, indeed, returns of dividend stocks are decent compared to bonds. But what about risks? How far will dividend stocks fall in case of market being spooked out.
My work says a top is close at hand – for a 1 to 2 week correction – nothing more. VIX is a hedging instrument used by big institutions. To truly gauge dumb money positioning, CPC and CPCE is the best one. Both 10 day rolling summed puts vs call for CPC and CPCE are in topping range (i.e., dumb retail traders are buying calls with both hands) whereas smart money OEX Open Interest PCR is also hitting extremes (i.e., smart money is buying puts). This is my favourite trading setup (smart and dumb money trading opposite each other and both hitting extremes) and I am expecting some volatility to start showing up within a few days. However, I am not looking for a crash or a big decline ala Aug 2015 and Jan 2016 because my measure of internals for SP 500 is nowhere near the big divergences that showed up in Aug and Dec last year.
I would agree with the shallowness of the pullback, though I have no opinion on the duration.