I present for your consideration the following mystery chart. Would you rate this as a “buy”, “hold” or “sell”? Your answer will tell you something about your global macro-economic outlook and the likelihood of an equity bear market in the near future.
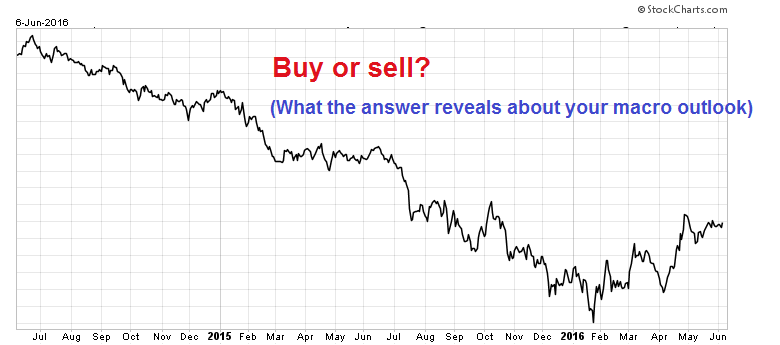
Scroll down for the answer…
Any of the recessionistas who ranked the above chart “buy” might want to read this post carefully, including everyone who jumped on the JP Morgan rising recession risk bandwagon and David Rosenberg’s abrupt bearish turn.

Mystery revealed
I am indebted to Joe Wiesenthal, who tweeted the following macro insight from Citi. The mystery chart is the relative return of the Russell 1000 Value Index against the SP 500. Value stocks have become the market leadership in the past few months. According to Citi, the Value style appears to be positively correlated with global growth and a risk-on environment.

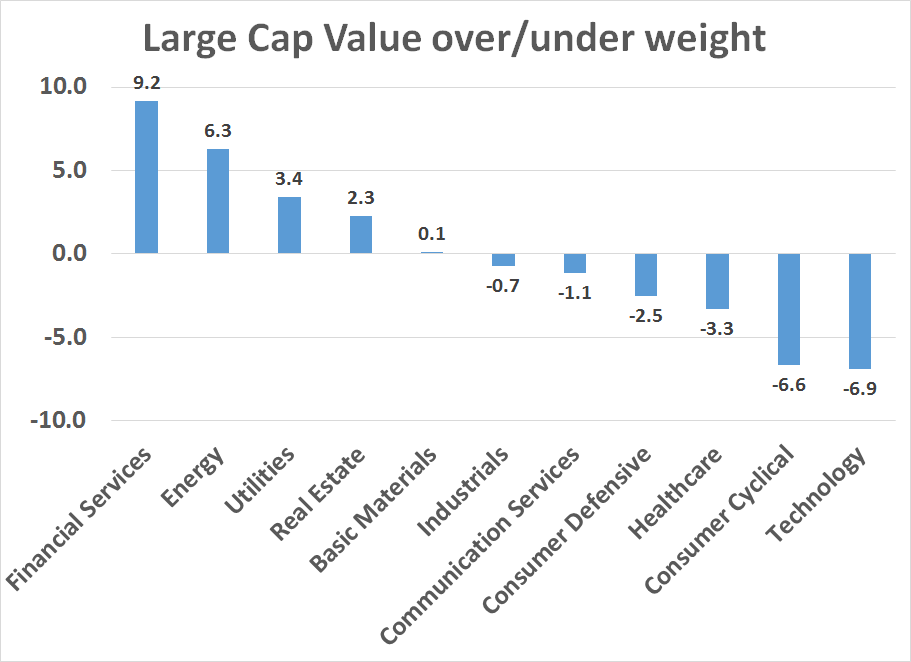
Indeed, an examination of the over and underweight of the Russell 1000 Value Index against SPX shows the main overweight positions are in Financials and Energy while the main underweight positions are in Consumer Cyclical and Technology. It is therefore no surprise for Citi to come to the conclusion that a Value exposure represents a bet on Oil, Interest Rates, Commodities and Credit.
Incidentally, if you were wondering why an overweight position in Financial stocks represent a bet on growth, the chart below shows that the relative performance of Financials is correlated with the shape of the yield curve, as measured by the 10 year UST yield – 2 year UST yield (green line).
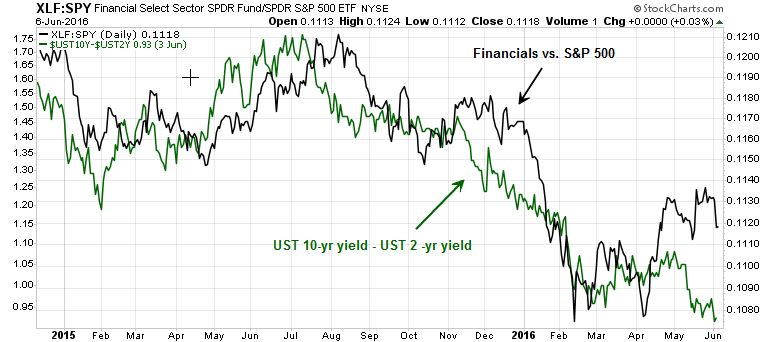
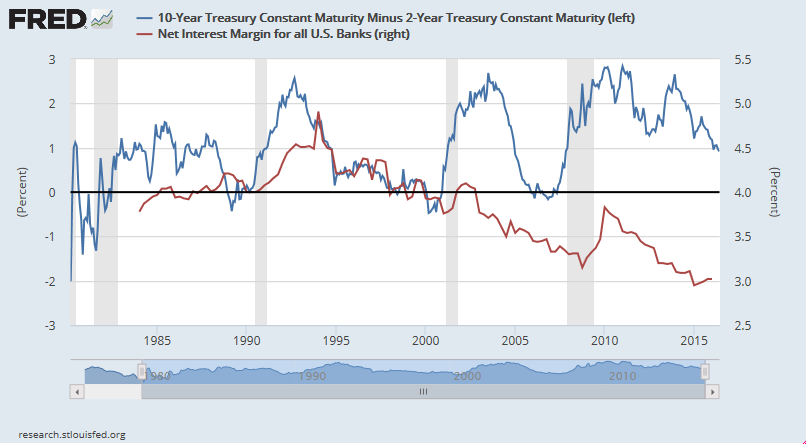
There may be a correlation vs. causation problem going on here. That’s because the shape of the yield curve has also been correlated with banking interest rate margins.
For the recessionistas: If you really believe that a recession is just around the corner and you ranked the mystery chart pattern as a “buy”, would you be more comfortable with shorting it instead?
Distilling the “pure” Value effect
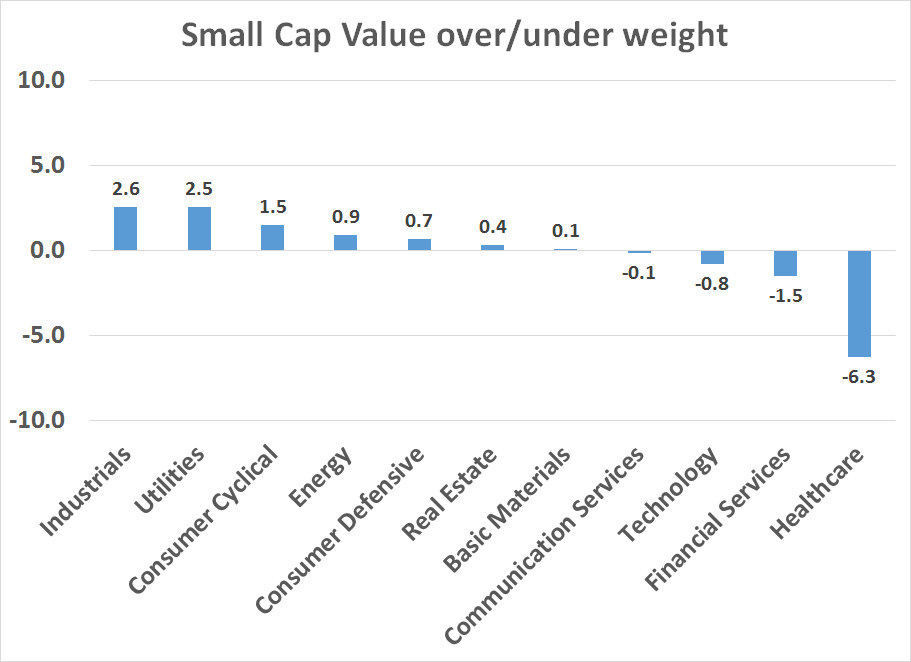
Despite the Citi analysis, an exposure to the Value style isn’t just a strict exposure to better growth and a risk-on environment. We can see a better view of the “true” effects of Value by analyzing the sector exposure of small cap value stocks. The chart below shows the over and under-weight positions of the SP 600 Small Cap Value Index against the SP 600, using the same +10% to -10% over and underweight Y-axis of the previous chart. By this metric, there are very few significant sector bets in small cap value stocks, with the exception of an underweight position in Healthcare.
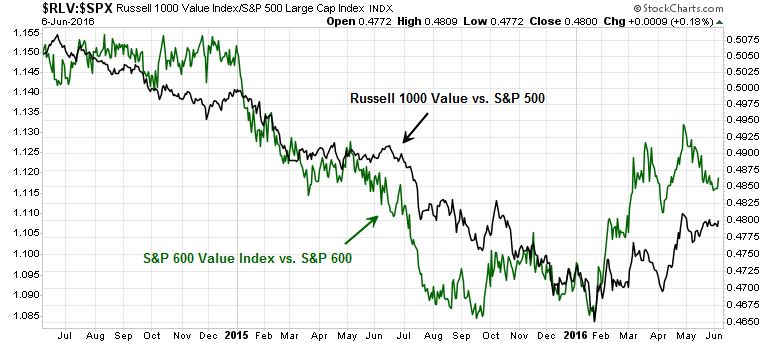
However, the relative return pattern of large and small cap value stocks are roughly the same. The relative performance of small cap value bottomed earlier than large cap value, though they both turned up at about the same time.
In conclusion, while the recent positive performance of the Value style is undoubtedly affected by the macro exposures identified by Citi, the relative returns of small cap Value suggests that the recent Value outperformance is positive net of sector and macro effects.
We are in a yield-centric world now that a ‘lower-for-longer’ viewpoint is arising after the shocking fall of bond rates after the Fed raised rates in December. We all expected rates would ramp up when the lid was removed from ‘artificially low rates’. But no, they fell. That makes the growing yield on the stock market extremely generous. Dividend ETFs have outperformed the S&P 500 by 10% since.
Value ETF pays 2.6% and Growth ETF pays 1.4%. With the new focus on dividends, Value is outperforming, very simple. I believe the economy, earnings, balance sheets, China or Brixit has very little of any influence. Relative yield to bonds is the key. The weak jobs report, just opened the eyes of a few more tens of millions of investors to see that ‘lower for longer’ is happening. I can feel the mood changing.
Here is what Warren Buffett said last year: “What you can say now — [it’s] not very helpful – but the market against normal interest rates is on the high side of valuation. Not dangerously high, but on the high side of valuation. On the other hand, if these interest rates were to continue for 10 years, stocks would be extremely cheap now. The one thing you can say is that stocks are cheaper than bonds, very definitely.”
He was talking about the market being on the high side of valuation based on historical earnings comparisons. But, the new low interest rate outlook has shifted valuation based on dividends to being much cheaper. The extent of the swing in value is anyone’s to guess depending on one’s answer to ‘how low, how long’? But the swing to a cheaper valuation is very large over the months since the Fed blew the lid off the Fed Funds rate (note sarcasm here). I expect we will all ratchet our ‘how low, how long’ down as we go through 2016. That’s all good for dividend stocks.
Can we have a bull market that focuses on dividends in a flattish earnings environment and no recession. I think so. Dividends of the S&P are forecasted to rise 6-7% this year. Add to this a market the goes up 25% to drive the yield down from 2% to a still rich 1.5%. Bingo, a Merry Christmas.
Thanks as always for sharing your viewpoint. The thing I’m not sure about is how we can compare stock yields to bonds’ since market volatility is a big factor. I mean stock yields have to be significantly greater than treasuries but how much more is enough to make it equally or more attractive.
Nice Information. Thanks.
Volatility is a factor only in the short term. A long term investor comparing bonds to dividend yields is likely a long term investor. Also, one can minimize risk greatly nowadays by using a dividend ETF. They own a large number of companies so single company risk is eliminated. They also have a methodology of changing their holdings on a disciplined basis. So one can look at them as a large unit category to compare to bonds as their category.
Rarely do dividend stocks make a major revaluation that makes them a short term outperformer. It happens only when rates make a substantial positive change. But that is what’s happening now. ‘Lower for longer’ is percolating in investors minds.