Mid-week market update: In the short run, the SPX has pulled back and appear to be about to test its 50 day moving average (dma) at 2040, while experiencing a positive divergence on RSI-5.
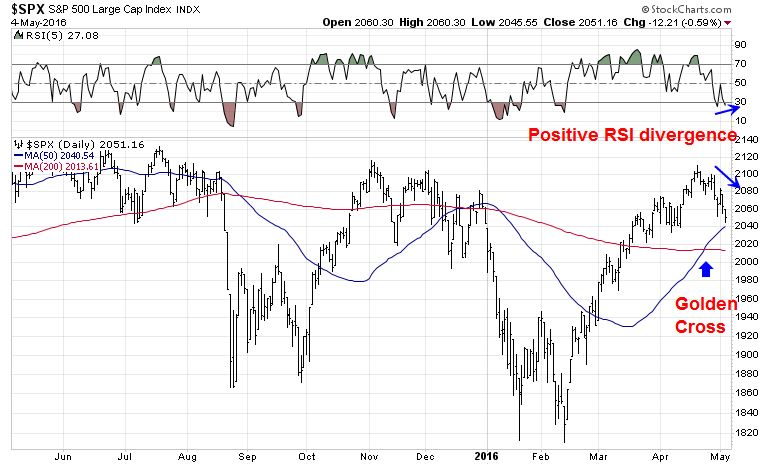
The SPX saw a Golden Cross last week – and the right way to trade these signals is to use the faster moving average as a trailing stop. Until the 50 dma is breached in a definitive way, my inclination is to give the bull case the benefit of the doubt.
In addition, the charts below show that the growth recovery theme is intact. The top panel shows that the yield curve (green line) is steepening, which is an indication that the bond market expects better growth and higher inflation. In addition, the relative performance of the financial sector, which is highly correlated to the shape of the yield curve, confirms that expectation. As well, the relative performance of the cyclically sensitive energy and mining stocks also point to a cyclical turnaround.

Finding the pain trade
In the current environment, positioning is an important consideration for near-term returns. Steve Cohen recently attributed the February selloff to crowding by hedge funds:
Billionaire investor Steven Cohen said that too many hedge funds placing the same types of bets contributed to sharp losses for his $11 billion Point72 Asset Management earlier this year.
“One of my biggest worries is that there are so many players out there trying to do similar strategies,” Cohen said Monday, speaking at the Milken Institute Global Conference in Los Angeles.
“If one of these highly levered players had a rough run and took down risk, would we be collateral damage?” Cohen said. “In February we drew down 8 percent which for us is a lot. My worst fears were realized.”
So what`s the pain trade here? After such a dramatic recovery in stock prices, shouldn’t sentiment be more euphoric?
Consider how the latest AAII sentiment survey showed a retreat by the bulls from very low levels (via Bespoke):

…and the bears coming out of the woodwork:

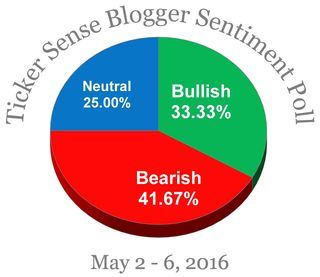
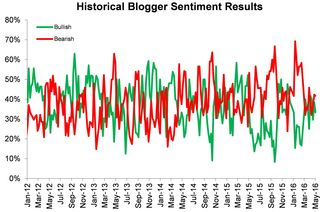
Can someone please explain to me why the TickerSense Blogger Poll is showing more bears than bulls after a huge market rally?
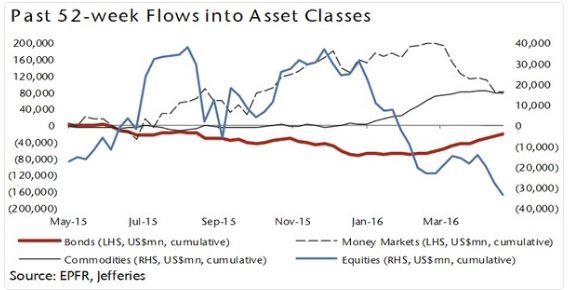
Fund flows data confirms the level of market cautiousness, as investors have been abandoning equities.
The level of bearishness may be reaching a crescendo. Barron`s reported that option players are making a massive “Sell in May” bet by buying VIX calls and hedging them out with long call positions in the SP 500 Index. Is this an example of a Steve Cohen style levered trade?
For a different perspective, Josh Brown recently pointed out that that low-volatility ETFs have been receiving the lion’s share of fund flows. In effect, market participants have been getting “chicken long” the stock market – buying in, but hedging their bets in a defensive fashion. The chart below shows how the low-vol ETF (USMV, green line) has outperformed SPY (red line). Cautiousness is the now new crowded trade. That’s where the pain trade is likely to be when it reverses.

Downside risks
To be sure, the bulls face a number of risks:
- A more hawkish Fed: Bloomberg reported that Atlanta Fed President Dennis Lockhart and San Francisco Fed President John Williams both indicated that the June meeting remains “live” for a rate hike. In a separate report, Lockhart toned down his hawkishness by stating that the Brexit vote, which occurs after the June FOMC meeting, “looms large”. If the Fed is intent on signaling that they are likely to raise in June, watch for more hawkish Fedspeak in order to “correct” the market’s perception.
- A growth scare: Bloomberg reported that global PMIs are stalling, which may spook the markets. However, New Deal democrat recently concluded that the shallow industrial recession is ending. Similarly, the nowcast analysis from Gavyn Davies came to a similar conclusion about the US economy. However, we may have to wait a few more weeks for more definitive signs of a turnaround.
- Presidential campaign mudslinging: Now that it appears that the presidential election will be a Trump vs. Clinton contest, prepare for lots of mudslinging, which could have unknown effects on market psychology.
Until I see greater confirmation that the bears have seized control of the tape, such as a definitive break below the 50 dma, my base case scenario is that the US equity market is seeing a pullback in the context of an intermediate term uptrend. I am inclined to agree with the assessment of Jeff deGraaf that you shouldn’t be shorting this market, at least for now.
Disclosure: Long SPXL