Model signal summary
Ultimate market timing model: Buy equities
Trend Model signal: Risk-off
Trading model: Bullish
The “Ultimate Market Timing Model” is a long-term market timing model based on research outlined in our post Building the ultimate market timing model.
The Trend Model is an asset allocation model which applies trend following principles based on the inputs of global stock and commodity price. In essence, it seeks to answer the question, “Is the trend in the global economy expansion (bullish) or contraction (bearish)?”
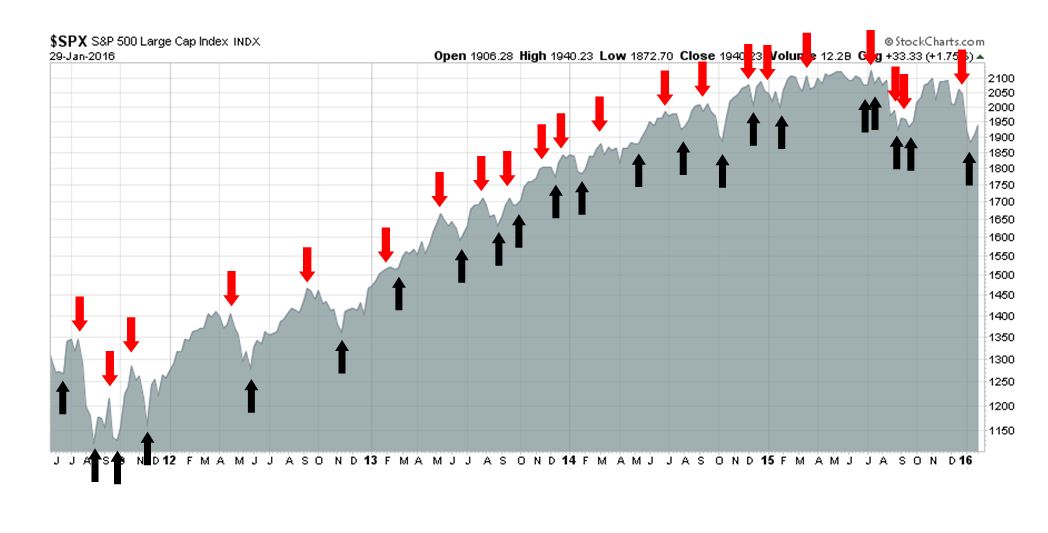
My inner trader uses the trading model component of the Trend Model seeks to answer the question, “Is the trend getting better (bullish) or worse (bearish)?” The history of actual out-of-sample (not backtested) signals of the trading model are shown by the arrows in the chart below.
Update schedule: I generally update model readings on my blog on weekends and tweet any changes during the week at @humblestudent.
Confirmation of limited tail-risk
Whew! Q4 GDP came in at 0.7%, which was below expectations of 0.8%, but growth was still positive and well above some of the Apocalyptic calls for a negative print. This week, we saw further confirmation that macro tail-risk is limited. The US economy is not headed for a recession and the downside risk from China has also been contained.
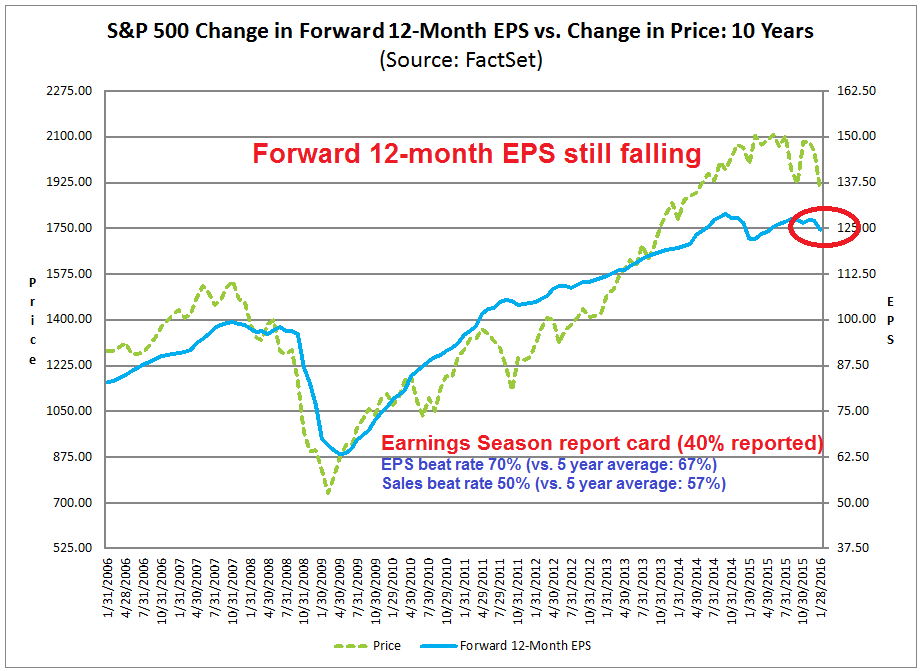
Nevertheless, the stock market remains jittery and will likely remain so for a little longer. The main source of anxiety is coming from the earnings outlook. The interim report for Q4 Earning Season is out and it got a bare passing grade. With 40% of the SPX having reported, the latest update from John Butters of Factset shows that the EPS beat rate coming in at above average, but sales beat rate below average and, most importantly, forward 12-month EPS continuing to slide (annotations in chart below are mine).
No recession on the horizon
Until forward EPS starts to turn up, stock prices are likely to remain range-bound and trade in a sloppy fashion. From a macro perspective, the greatest anxiety comes from the weakness in industrial production and ISM Manufacturing, as exemplified by the disappointing capital goods order release last week.
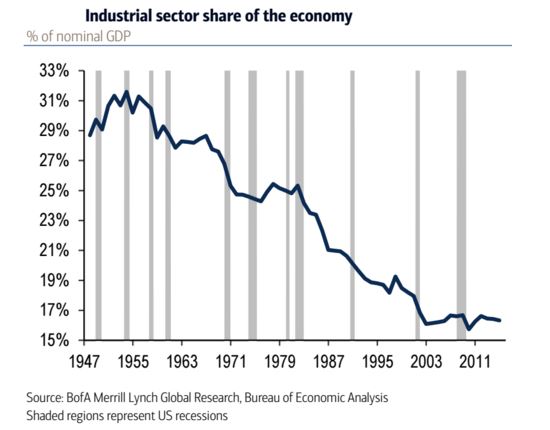
However, I would point out that the share of the industrial sector of the economy has been in secular decline, so the importance of its weakness is diminished.
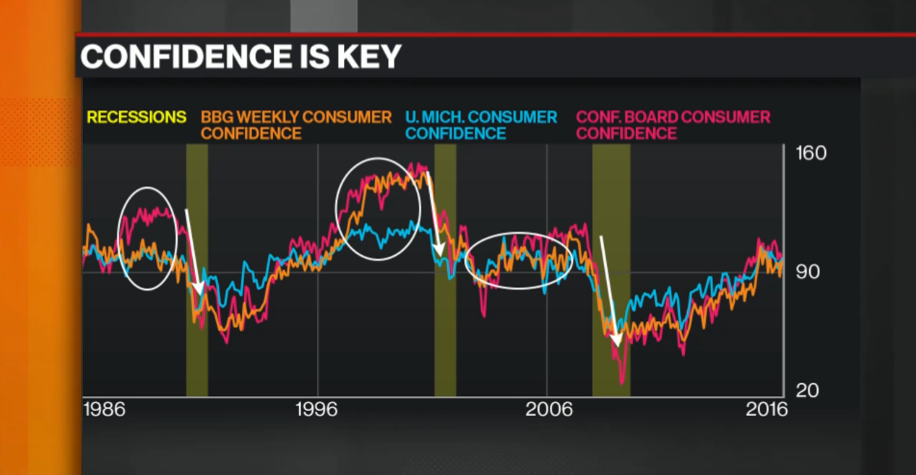
As for the rest of the American economy, George Pearkes of Bespoke recently pointed out that consumer confidence has been healthy. Recessions simply do not start with consumer confidence on the rise like this.
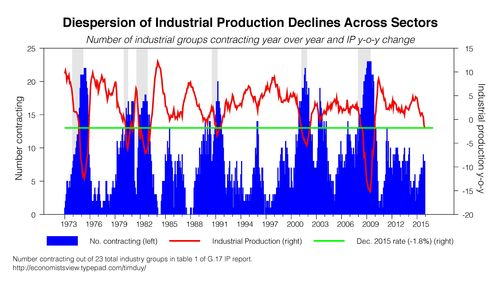
Tim Duy noted that even within the so-called “weak” industrial sector, the weakness isn’t very broad based. He pointed to work by Josh Lehner indicating that the decline in industrial activity is not well dispersed across the sector:
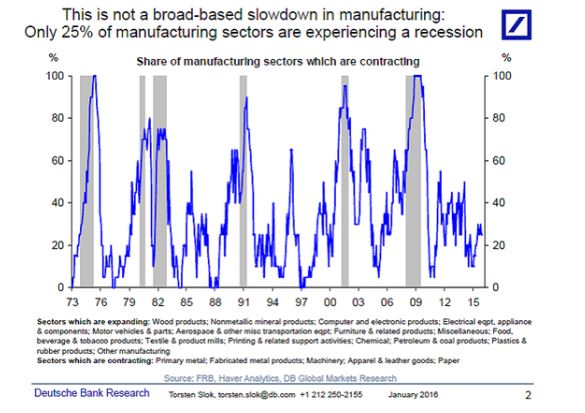
Analysis from Deutsche Bank confirmed Duy’s point.
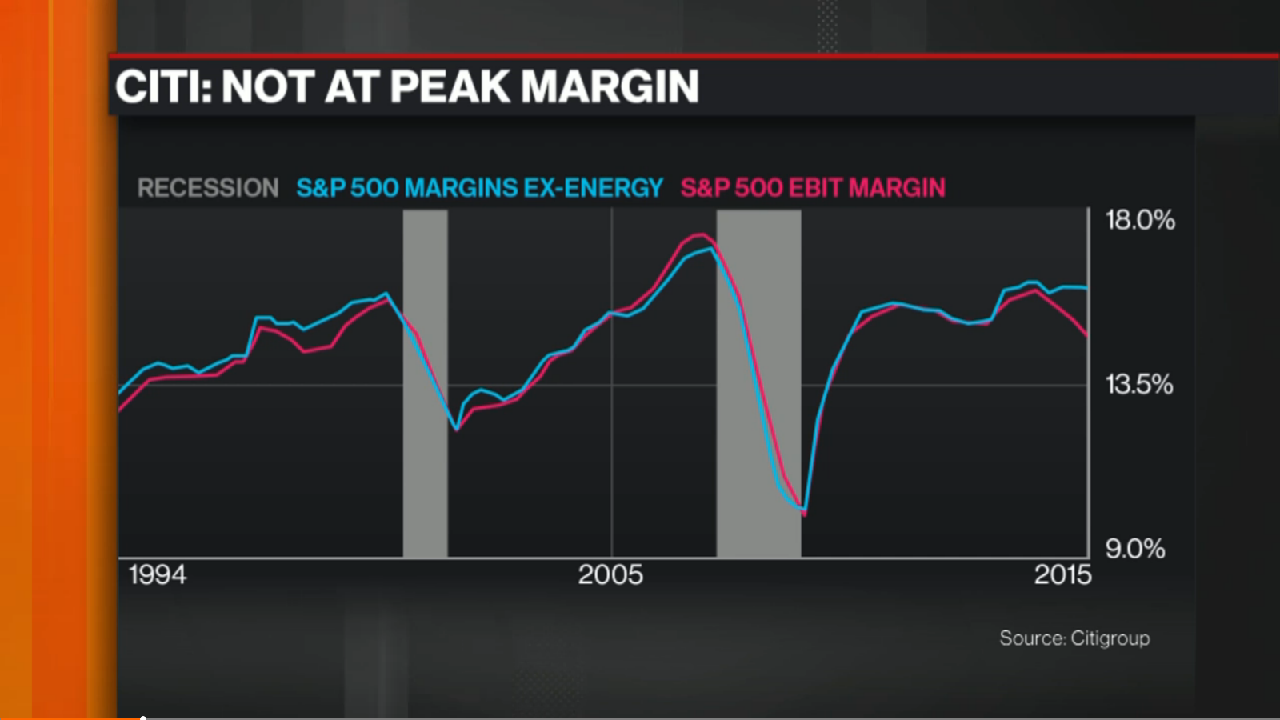
Most of the weakness observed in industrial production, as well as forward EPS, has been related to the resource sectors. Analysis from Citi showed that EBIT margins on remains healthy on an ex-energy basis. In short, operating margins are not turning down despite the headwinds posed by a rising USD.
So relax. The US economy is highly unlikely to roll over into recession. The SPX earnings outlook is healthy, especially if you exclude the troubled energy sector.
China: Is this as bad as it gets?
What about the concerns over a China slowdown? Could that drag the US into a recession?
The transmission mechanism of apparent economic weakness in China has been through lower commodity prices, which has also tanked the emerging market (EM) economies.
Ed Yardeni recently explained it this way: EMs borrowed too much USD because of an easy post-GFC Fed and the recent rally in the trade weighted dollar is largely attributable to a short-covering rally by EM borrowers:
The Fed’s easy monetary policies at the beginning of the previous decade certainly contributed to the subprime mortgage mess. This time, the Fed’s easy money in recent years encouraged borrowers in emerging markets (EMs) to borrow lots of money from banks and in the bond markets to expand commodity production. A significant amount of that debt was in dollars. The prospect of the tightening of US monetary policy after so many years of near-zero interest rates caused EM borrowers to scramble to sell their own local currencies to buy dollars to pay off their dollar-denominated debts…
From this perspective, the 23% increase in the trade-weighted dollar since July 1, 2014 is to a large extent a massive short-covering rally by EMs. The soaring dollar increased the local currency prices of commodities priced globally in dollars. It’s likely that the plunge in commodity prices might have been triggered by the short-covering dollar rally combined with the tightening of credit for EMs. Of course, the supply-led glut of commodities only made things worse.
He concluded that contagion risks are limited because of the low level of leverage in the financial system related to EM and commodity-linked debt . In this case, there is no financial contagion.
My relatively optimistic spin has been that the dollar borrowing by EMs has been largely financed in the capital markets, which are better able to absorb shocks and losses than banking systems. Loans to EMs haven’t been sliced and diced into different tranches of credit derivatives as were subprime mortgages.
Of course, there are many high-yield bonds that were priced too cheaply and have seen their yields soar since mid-2014. However, they were never rated as anything other than junk. EMs and junk bonds have been great shorts recently, but I doubt there will be a sequel to “The Big Short” based on them.
In other words, this is as bad as the fallout from China gets. Weak commodity prices and weak EM economies may shake up risk appetite a little, but they’re not bringing down the global economy.
In fact, there are signs that the commodity price downturn is starting to stabilize. The chart below shows industrial commodities (top panel) and oil prices (bottom panel). Notwithstanding the headline grabbing decline in energy prices, industrial commodity prices seem to be putting in a bottom. They have flattened out in the last few months and actually rallied through a downtrend line last week. Equally constructive has been the action in oil, which has strengthened to test a downtrend.

Is the worst over? I don’t know. I will be monitoring these charts carefully. At a minimum, the situation in Commodity-Land is getting less worse. Should we start to see commodity prices bottom and strengthen, then pressures would start to come off the junk bond market. Such a development has the potential spark a surprise rebound in risk appetite.
Waiting for the re-test
With downside risk from a US recession and contagion risk from China contained, my inner investor concludes that the market has bottomed and Mr. Market has in effect running a post-Christmas sale tag on equities. He believes that this represents an excellent time to be accumulating positions in stocks that he likes.
My inner trader, however, isn’t convinced that the market is ready to take off just yet. He is waiting for a re-test of the lows. The technical damage done by the decline is too great and the general level of anxiety is still too high to support a V-shaped market recovery.
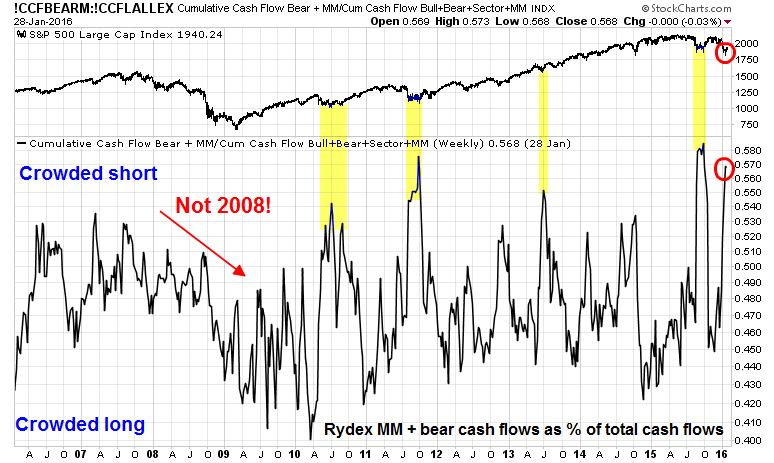
From a longer term perspective, the market appears to be undergoing a bottoming process. This chart of Rydex sentiment, which measures what people are doing with their money rather that just expressing their opinions in a poll, is flashing a crowded short reading. If the historical pattern holds, the market should undergo a multi-week sideways and choppy consolidation. This isn’t 2008, where the general public bought the market weakness as stock prices weakened. Downside risk is limited.
In addition, Barron’s reports that insiders have displayed a continuing pattern of buying. Prolonged bear markets simply do not begin with sentiment readings at these levels. At a minimum, I would be extremely cautious about being short for any period of time except for a quick trade.
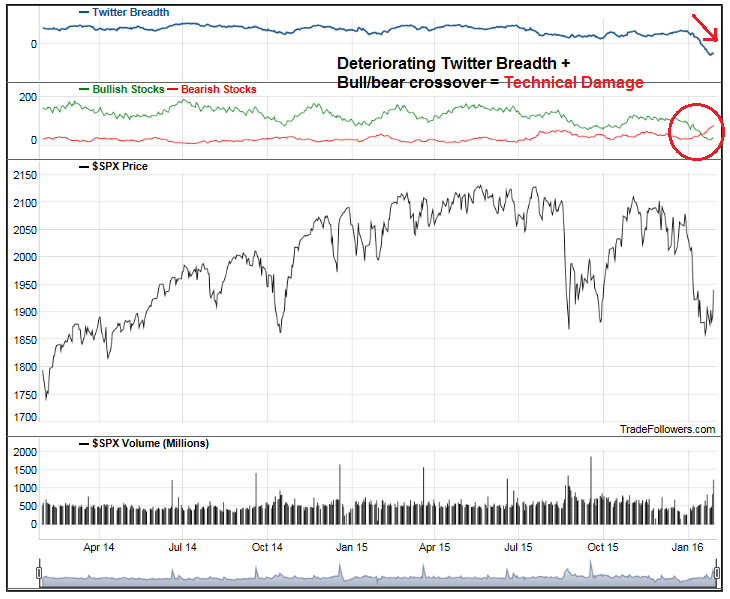
On the other hand, this chart from Trade Followers shows significant technical damage from deteriorating Twitter breadth and a crossover of bullish and bearish stock counts. Such damage typically cannot be repaired with a V-shaped bottom. Such conditions tend to resolve themselves with a basing period of sideways consolidation (annotations are mine).
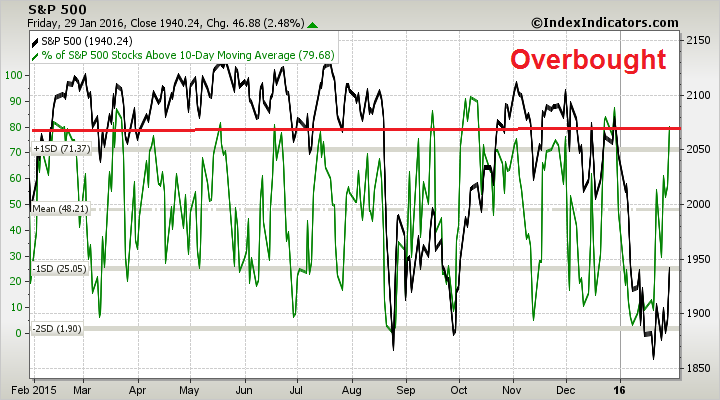
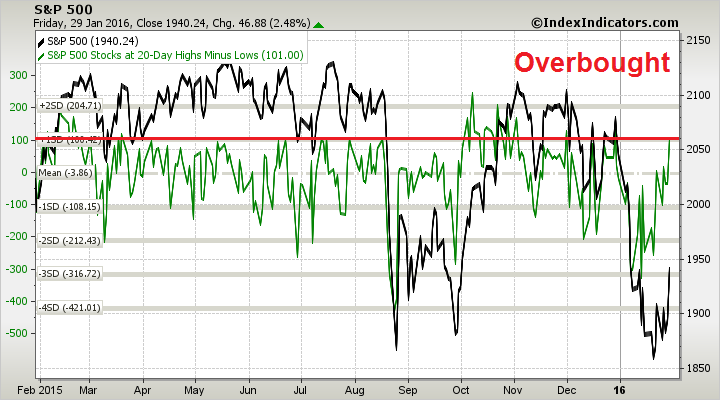
These breadth charts from IndexIndicators show that the market is overbought and vulnerable to a pullback (annotations in red are mine).
To be sure, there is still a remote possibility that the market is about to experience a Zweig Breadth Thrust (for a full explanation of the ZBT see Bingo! We have a buy signal!). While I am watching this carefully and we have another four days for the signal to be triggered, I’m not holding my breadth for that outcome. (For readers who want to follow along at home, use this stockcharts link for a real-time update).

I wrote last week that I had been expecting a short-term market rally and that I would be carefully watching the quality of the rebound. The jury is out as to whether this is a V or W shaped rally, but the weight of the evidence calls for a basing period after such a sharp drop. My inner trader began to scale out of his long positions on Friday. He remains open to the possibility that a V-shaped bottom has occurred, but he is maintaining tight stops on the remainder of his long positions. His preferred scenario calls for a re-test of the recent lows, with a possible violation of those lows as a way of flushing out any remaining bulls to form a capitulation bottom.
My inner investor, by contrast, is convinced that a bottoming process is occurring based on the constructive macro backdrop. He is long equities in anticipation for higher prices later this year, with an overweight position in the resource sector.
Disclosure: Long SPXL
Hi Cam
One of the other famous indicator Marty Zweig had to measure market momentum was up volume as percentage of the total volume. It went something like this: if there were two days when the up volume as percentage of the total volume was 90% on the NYSE with no day in between which was 90% down day it was considered the start of an intermediate uptrend. We have had Jan 22: 86%, Jan: 26: 90.34% and Friday Jan 29 :92%. All extremely bullish readings.
Add together that the Bank of Japan has dropped interest rates to negative, Europe is also doing the same therefore the likelihood of the Federal Reserve raising interest rates this year has dropped considerably. I think that is what the market is sensing. Any hike in interest rates with only strengthen the dollar having negative impact on our multinationals. May be the worst is over for this decline. The S&P 500 can reach 2025 to 2040 with ease at which point major resistance comes into play. Strong support is now at 1850.
Good Call.
re:”Zweig had to measure market momentum was up volume as percentage of the total volume”
There were 9:1 up volume days in 8/25/15 and 8/26/15 and we all know what happened: new lows were tested.
Hi Cam:
In all due respect, regarding your comment “that the risk from China has been contained”,
you should listen to the interview with Worth Wray on Financiial Sense Newshour this past week.
Clearly the negative interest rate policy of Japan resulting in a devaluation of the Yen has put even more pressure on China to significantly devalue their currency. Based on commodity consumption in China, it clearly is in a recession and the Yuan is 15-20% overvalued relative to their competitors currency. As Felix Zulauf also predicted back in November, China will continue to devalue their currency until their manufacturing sector picks up. This competitive devaluation will put significant pressure on emerging economies as the USD appreciates even further. For some reason you continue to disregard the signals from the global bond markets and banking industry. Look at the charts. Short term, yes there will be a rally, but it will be very brief as revenue and earnings for S&P stocks continue to decline. Longer term the decline has much further to go as all the global markets are in decline.
Worth Wray used to work for John Mauldin. Both of them have been permabears for at least a decade.
If you bet on the end of the world, you only get to be right once.
Well, I shorted Friday’s close and have been regretting it all weekend. That big green SPX bar sure looks like Friday might have been a recognition day. I’ll hope you’re right, but any gap up will be reinforced by my “buy to cover” order.
Cam, how much relevance do you give to the Forward 12 month EPS chart shown above?
The chart shows a significant breakout of price somewhen in late summer 2013. According to this chart we would be fairly valued somewhere around 1750 S&P (what I heard many talking heads call as a target of the recent decline).
If you don’t see it as very relevant how do you justify the disconnect from price to future earnings currently?
I fully agree with your assessments above and have my own thoughts about the described disconnect would just love to hear your unbiased opinion. Thanks in advance!
Jason –
Glad you were able to get onto the website. There are two ways to answer your question, depending on your time horizon:
1) In the short-term, it’s the rate of change in forward EPS that matters. A rising forward EPS implies a better outlook for earnings, which is bullish.
2) Your question also suggests that the market is over-valued. In the short-term, valuation has a way of mattering until it matters. I wrote about a year ago that: “During economic expansions, earnings and economic momentum growth drives stock prices. In a recession, it is valuation that provides a floor on equity values.” (See http://humblestudentofthemarkets.blogspot.com/2015/03/cheap-or-expensive-one-thing-about.html)
Valuations are elevated, but not stupidly high given the level of interest rates. It does imply, however, that the downside potential in the next recession and bear market could be considerable.
Cam is right. With S&P earnings yield of around 6.x%, (inverse of P/E ratio) and S&P dividend yield greater than 10 year treasury, stocks are not a bad a place to be. Could we get a 10% correction? Yes, of course, which would make stocks more attractive. How about a 20% correction? Make sure there is cash on the books if that were to happen. Liked market action today with VIX index closing below 20, S&P testing 1920 intraday and bouncing off, creating a new support level, ten year treasury about 1.91 (closed around 1.96). Loved the fact that oil pulled back 6.x% and stocks rallied. I would like to see stocks getting “unhinged” from oil, and we could well be seeing it. Looking more medium term, did not like the XLU:XLI widening gap. Did not like A:D issues only 1:1 and A:D volume 1:1.2 on NYSE.
how about the view from Felix Zulauf, a HF manager with very respectable track record.
http://felixzulaufblog.blogspot.hk/
Last few trading days, US stock futures started the day in the red. Once cash market opened, we ended up with a rally or neutral outcome. Today, futures markets have been in the red since last night, though as the US opens for business, futures are less in the red than a few hours ago. I find futures markets more correlated to market action in Europe and not highly correlated to the US cash market, unless the futures markets are printing extreme numbers. If the futures are strongly up or down, US cash markets usually open in the same direction. It would be interesting to see where we close today. S&P futures as I write, are down 0.74% (-14), which is not much in the scheme of things. Let us see if the 1920 level on the S&P holds today, and if “turn around tuesday” keeps its reputation.
Intermediate term, this market is tracking 2008 market, with January closing again below 12 month moving average. Even in the first half of 2008 there was a countertrend rally, but a difficult one at that. Markets do not track each other one to one, but it appears by some metrics, the next countertrend rally will hit resistance around the 2000 level on the S&P. Hard to predict future, but we shall see how this countertrend rally develops (or not).
At what level would you start buying again Cam?
Rather than think about levels, I would watch for a combination of oversold conditions and positive divergence upon a test of support.
We are not there yet. Be patient.