In my last post, I wrote about the possible appearance of a rare Zweig Breadth Thrust buy signal this week (see The 2016 macro surprise that no one talks about). Tuesday was the last day in the 10 day window for the ZBT buy signal to be triggered. Alas, it doesn’t seem to have happened.
So where does that leave us? The near term outlook for the bulls is still constructive, as the market has rallied through a key downtrend line (shown above). Moreover, we are still in a period of seasonal strength.
However, bullishly oriented traders should be wary about overstaying their welcome. The Santa Claus rally was nice but the party is starting to get out of hand. The neighbors have called the cops and they are due to arrive very soon.
What January effect?
One of the arguments for a continued near term bullish impulse is the so-called January effect, which is explained by a snap back from tax-loss related selling in December. This CNBC article document was written last year and it is slightly dated, but it nevertheless documents the diminishing power of the January effect. In short, most of the outperformance in January occurred in the 1980’s and 1990’s. January returns in the last 10 years have been nothing to write home about.
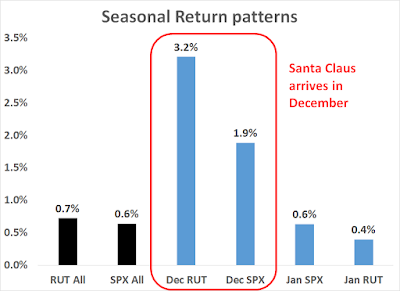
I went back to 1987 and studied the average returns of the SP 500 large caps (SPX) and Russell 2000 small caps (RUT). I found that while the markets seemed to have benefited from a December Santa Claus rally, January returns have been fairly ordinary.
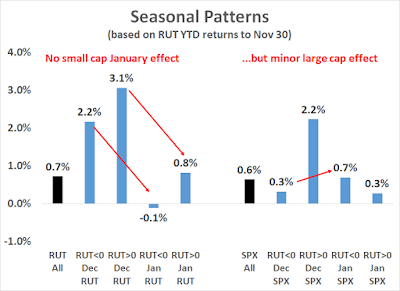
What about a snap back from tax loss selling? Could stocks perform better if we had a down year? I studied average stock returns based on whether the RUT was positive or negative on a YTD basis as of November 30. What I found was highly unexpected. Small cap stocks performed better in December as a whole and paradoxically did worse when November YTD was negative. In effect, ther was no small cap January effect. However, there was a minor large cap January effect as the SPX did perform better when RUT was negative YTD to November. That results seems somewhat dubious and illogical and I would attribute it to noise in the data.
What about small cap outperformance in January? If there was tax loss selling, could small caps perform better in January?
The chart below shows the small – large cap return spread in December and January, based on RUT YTD returns to November 30. The data shows that average small vs. large cap spread actually perform worse in January when RUT is down YTD to November.
So much for the January effect.
Fewer buybacks
In addition, bullish traders face additional headwinds in January. This chart from Goldman Sachs (via Business Insider) shows that the pace of share buybacks tend to drop dramatically in January. That removes another key source of demand for equities during this period.
Don’t overstay the party
In conclusion, had another ZBT buy signal been triggered, my inner trader would have gone all-in on the long side of the market. Instead, he is turning more cautious. While the combination of short-term seasonal strength, a bullish impulse that broke both a downtrend line and the 50 and 200 dma are to be respected, the market is nearing overbought readings, as measured by RSI5.
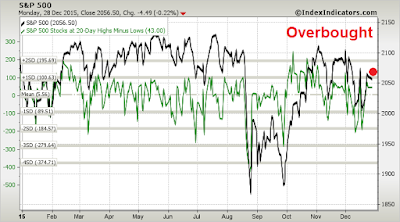
As well, this chart from IndexIndicators of the net 20 day highs-lows is in the overbought zone (red dot is my estimate), which is an indication that upside is probably limited.
Bottom line: The bulls shouldn’t overstay their welcome during this seasonal rally. Start edging towards the door before the cops show up and raid the party.


Let me put in a plug for gains in the intermediate term through to spring albeit with the odd bump in the road. This comes from my reading David Rosenberg’s newsletter. The last couple of years has seen an unusually weak U.S. economy in the first quarter due to cold weather. Likely this won’t happen in 2016. Because economic stats are seasonally adjusted, they will give a big boost to whatever happens in the first quarter because the last two were weak. So the economic numbers will be super.
Even without the artificial boost to the numbers, we are going into 2016 with consumer confidence strong. Christmas spending up a ripping 7% plus YOY. Wage gains are strengthening. Gasoline and natural gas heating bills are down dramatically giving consumers more cash to spend elsewhere. Congress just pass a budget that will boost the economy by almost 1%.
So the economy will be perfect for a strong stock market.
Importantly, general sentiment towards the stock market is very skittish. Small investors have been pulling money out of equity mutual funds like we saw at the bottom in 2008-9. Margin loans are weak. Experts are worried about the junk bond market. I don’t see the type of optimism that signals a market peak. If anything I see many sectors that have been going down long enough to be called bear markets with extreme pessimism typical of a bear market low.
When the worst fears of investors don’t happen as we enter 2016, I expect the strong economy will have investors using cash earning almost nothing to buy stocks. If an unusually big move was to happen in the next few months, I would bet on a melt-up versus a melt-down.
I agree. Base case is we get a pause and minor pullback in Jan/Feb. Nothing to get overly panicked over.
Where’s the next party?
F
Fritz,
We were waiting for your invitation!
RSVP to: My 401 AXA GIO! ;-}
Timely post. Nice going, Cam
Cam,
This Dana Lyons post is always in the back of my mind :
http://jlfmi.tumblr.com/post/125406405445/the-summation-of-all-fears
If I’m reading this right, we will be able to buy this market cheaper in the summer, and maybe considerably cheaper than we can right now. Of course just because an indicator has never failed doesn’t mean it can’t.
The thing that attracted me to your site was your in and out method, and it should keep us from disaster should it occur. Still, I’d love to hear your comment on this.