Trend Model signal summary
Trend Model signal: Neutral
Trading model: Bullish
The Trend Model is an asset allocation model which applies trend following principles based on the inputs of global stock and commodity price. In essence, it seeks to answer the question, “Is the trend in the global economy expansion (bullish) or contraction (bearish)?”
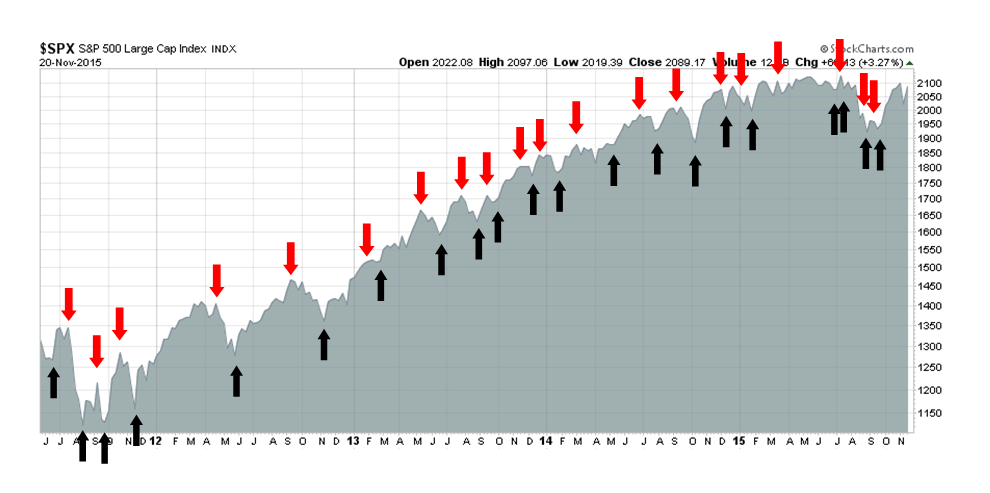
My inner trader uses the trading model component of the Trend Model seeks to answer the question, “Is the trend getting better (bullish) or worse (bearish)?” The history of actual out-of-sample (not backtested) signals of the trading model are shown by the arrows in the chart below.
Update schedule: I generally update Trend Model readings on my blog on weekends and tweet any changes during the week at @humblestudent.
Good news and bad news
The market action last week saw some good news and some bad news. The bad news came in the form of weakness in the Greater China equity markets, but that was offset by the goods news of upside breakouts in Europe and a positive relative strength showing by US small caps. When I net it all out, I remain constructive that equity bulls will see another visit from Santa Claus this year.
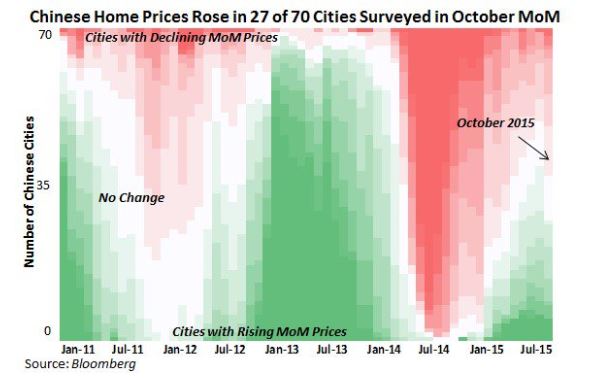
First, the bad news. China is slowing again. Real estate prices, which represent the most levered and exposed part of the economy, is rolling over after a brief bout of strength.
The news that broke Friday indicating that Chinese authorities are investigating several major brokerage houses did not help the Chinese stock markets. More worrying is the behavior of the regional Greater China markets. As the chart below shows, three of the five markets of China`s major Asian trading partners have violated their 50 dma, which indicates rising anxiety.

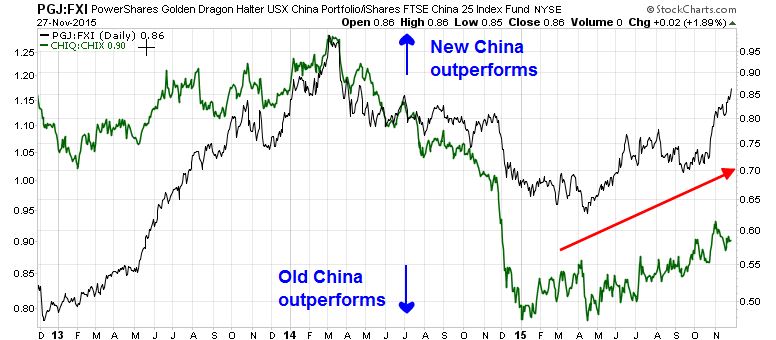
The silver lining is that real-time indicators of economic re-balancing is continuing. My New China-Old China pairs continue to show that consumer related stocks, which represent the New China, are outperforming financials, which is more indicative of Old China (see Two better ways of playing Chinese growth).
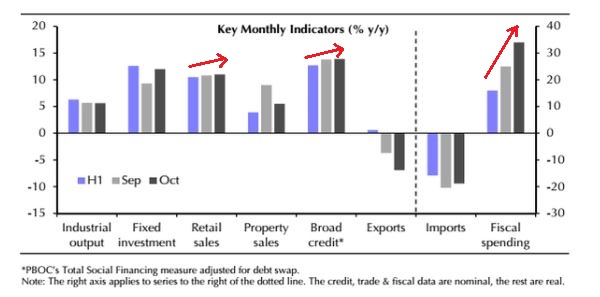
Overall, Chinese economic indicators aren’t that bad despite the wobbly regional Greater China stock markets. Consumer spending is rising, which is indicative of re-balancing, and both fiscal and monetary stimulus, as measured by credit growth, are positive (via Ambrose Evans-Pritchard).
There is no need to panic.
Upside breakouts in Europe
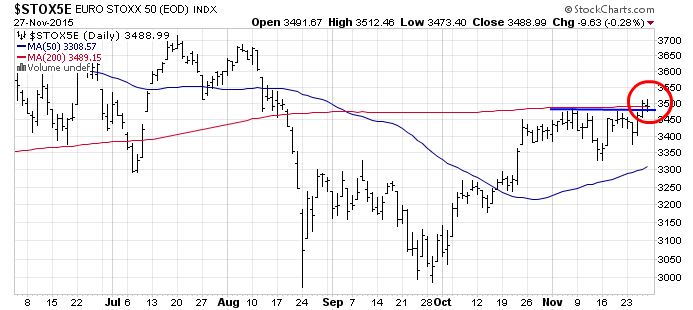
By contrast, an unambiguously bullish development for global stock prices came in the form of upside breakouts in Europe. The chart below of the Euro STOXX 50 shows a double upside breakout through technical resistance and the 200 dma.
The UK market, which has a heavier energy weight, also showed a constructive upside breakout through a downtrend. The chart below shows the FTSE 100 in both panels. In the upper panel, I have drawn the trend line through the daily highs and the upside breakout is less clear. The bottom panel only uses closing prices and the breakout is more distinct in that chart.

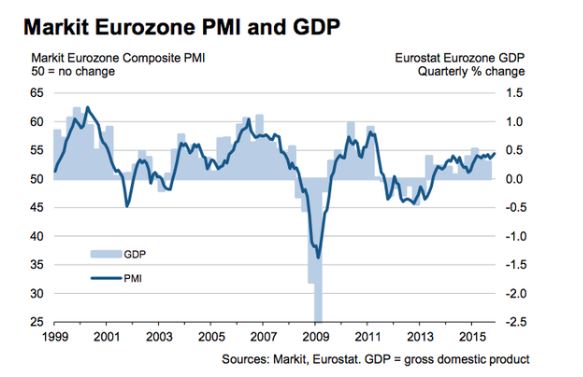
The better stock market performance in Europe is reflective of improving fundamentals and more stimulative policy. Eurozone PMIs are improving and readings are at a 54 month high:
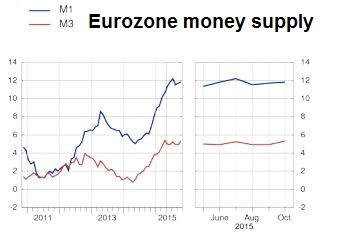
Moreover, money supply has been growing at a healthy clip and it remains to be seen whether the ECB will take further steps on QE next week, which is a development that Mario Draghi has hinted heavily about.
Better US small cap performance
The so-called Santa Claus rally each year usually occurs either in December or January. One of the explanations advanced for this seasonal effect is a rebound from year-end tax loss selling, which is most pronounced in the less liquid small cap names.
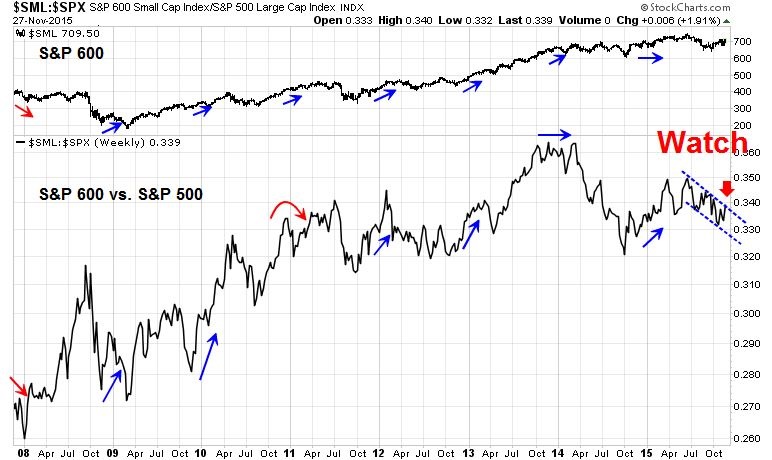
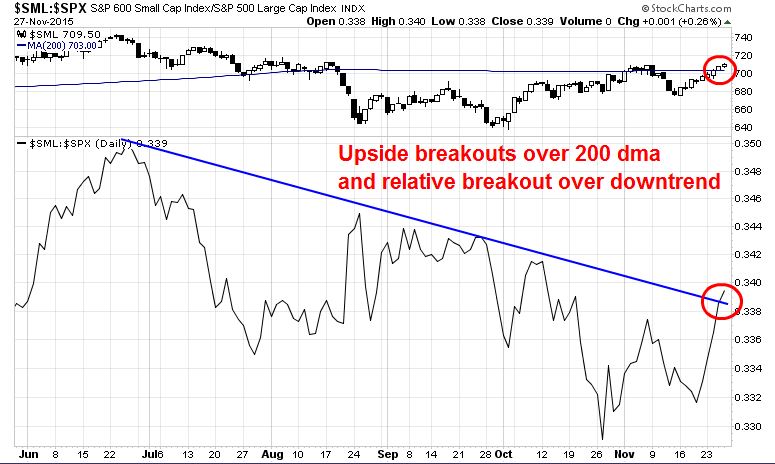
The chart below depicts the small cap SP 600 in the top panel and the relative performance of small vs. large caps in the bottom panel. As the chart shows, small caps have assumed the market leadership in virtually every year since the onset of the GFC. This year, small caps are in the process of staging a relative breakout against large caps, indicating improving relative strength. These readings suggest that another small cap rally is likely this holiday season.
Here is a closer look at the small vs. large cap performance chart for 2015. The breakouts are more evident as we zoom in, both from absolute and relative frameworks.
Improving fundamentals
Equally encouraging for a Santa Claus rally, which I define as a stock market rally led by small caps, is the improving forward EPS revisions across market cap bands. The chart below from Ed Yardeni shows that forward EPS is rising across the board, which is bullish. The latest figures show that SPX forward EPS rose 0.07% in the latest week.

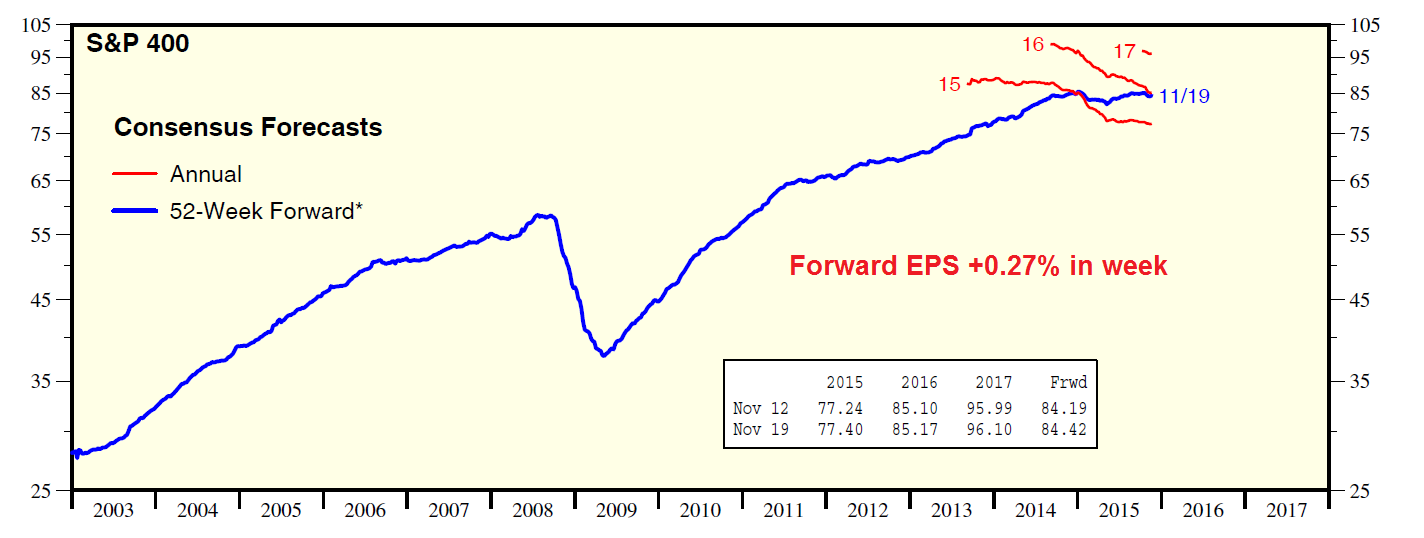
Here is the evolution of forward EPS in the midcap SP 400, which saw a more pronounced upward revision when compared to large caps.
Best of all was the improvement in small cap forward EPS.

The positive earnings outlook is confirmed by Barron’s report of insider activity, which shows that this group of “smart investors” are still buying.
More room for a bull run
Peering into next month, this chart from IndexIndicators shows that the SPX is exhibiting positive momentum, but the market is not at the overbought levels seen in past Decembers. There is more room for the bulls to run.

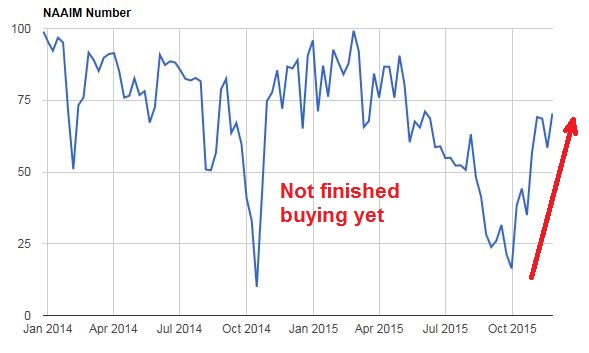
The latest figures from NAAIM show that RIAs continue to buy stocks. Equity exposure is still recovering from August/September correction levels, which sets up the potential for a FOMO rally into year end should positive price momentum persist, which it is likely to.
When I add it all up, these are all signs that Santa is coming to town this December.
Beware the tax-loss Grinch!
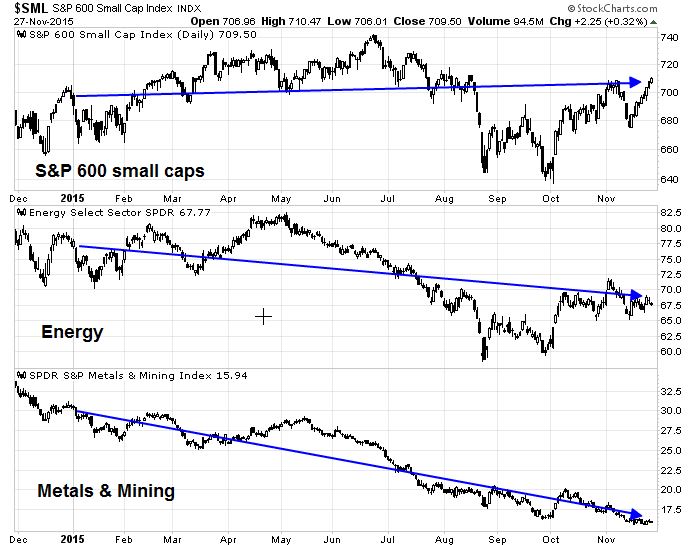
Regular readers know that I have been bullish on late cycle sectors such as the commodity related sectors of the market (see How to energize returns even as momentum fades). While I remain positive on these sectors longer term, I would be tactically cautious about these stocks in the near future as tax loss selling is likely to put downward pressure on them. The chart below shows the performance of small cap stocks, which has lagged large caps lately, compared to the energy and mining sectors. As the chart shows, commodity related names have fared far worse than small caps and therefore they may see further selling pressure during tax loss selling season.
My inner trader will be opportunistically switching out of part or all of his commodity related equity long positions for small caps in days to come. My inner investor remains constructive on energy and materials and he is not concerned about these minor blips.
My bullish stance isn’t without risk, however. In a future post, I will go full “Zero Hedge” and outline the numerous stock market landmines of 2016.
Disclosure: Long SPXL, ERX, NUGT