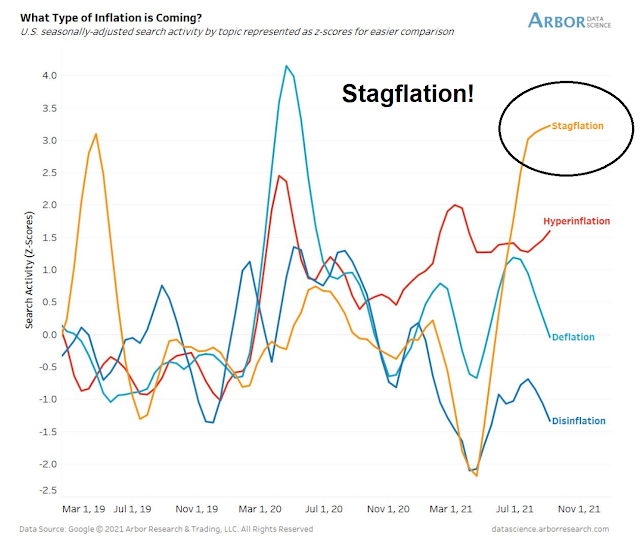
Stagflation worries are rising. A recent analysis of search activity shows that searches for stagflation have spiked compared to other inflation search terms.
What is stagflation?
The culprit is some mix of disrupted supply chains, high transportation costs, container scarcity and congested ports…
Fewer chief executives have confidence that such disruptions are temporary and quickly reversible. This will restrain growth plans despite robust demand, and increase pressure to raise prices to offset higher costs…Such reversible factors are accompanied by supply side troubles that could last for one to two years, if not more
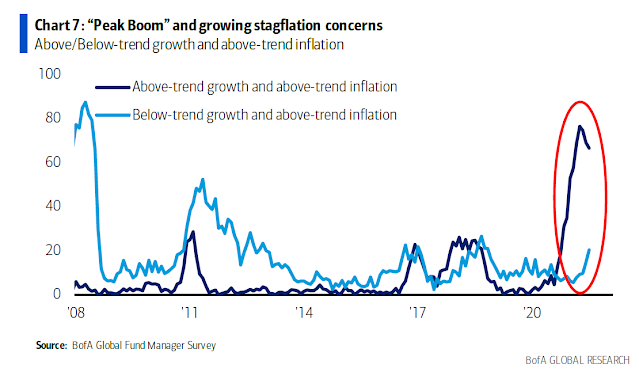
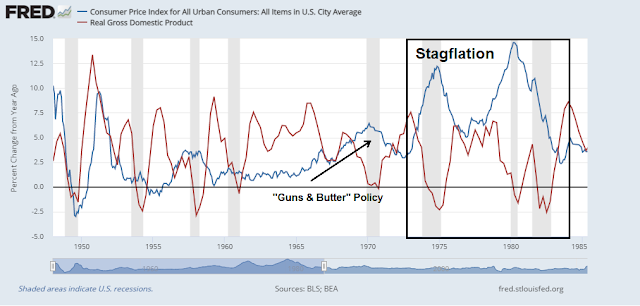
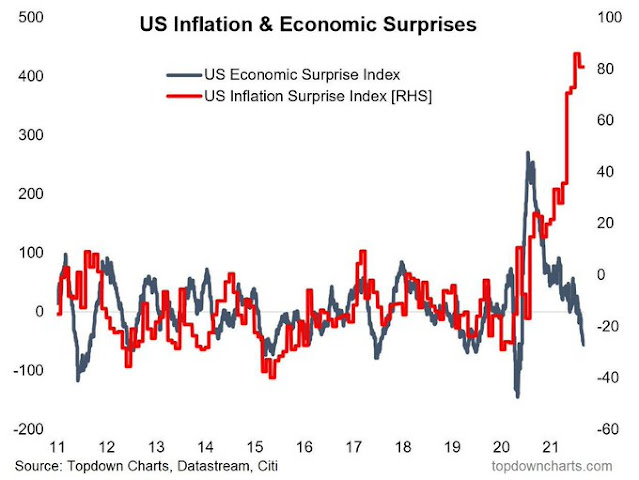
Added to inflation already in the pipeline, all this translates into stagflationary winds for the global economy that are unfamiliar to those that did not live through the 1970s.
Misplaced fears
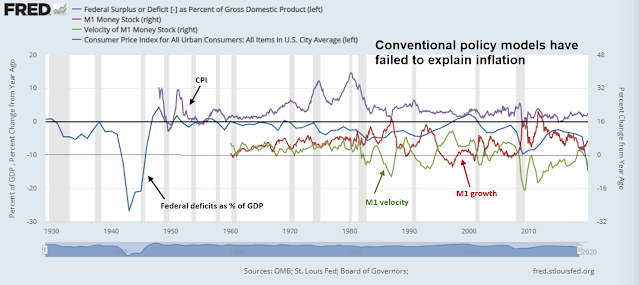
It is said that deficit spending would lead to currency devaluation and inflation in the manner of the Weimar Republic. Nothing could be further from the truth. The blue line represents federal government deficits as a percentage of GDP. Deficits began to balloon in the early 1980`s with the Reagan Revolution and continued during the Bush I era. Did inflation (purple line) explode upward?
Monetary policy had its own failure. Monetarist Theory, as popularized by Milton Friedman, was another model that backtested well but failed out of the box. Friedman postulated that the PQ=MV, where the Price X Quantity of goods and services (or GDP) = Money Supply X (Monetary) Velocity. Friedman theorized that, over the long run, monetary velocity is stable, and therefore money supply growth determines inflation. All central banks had to do was to control money growth in order to control inflation.
It worked until about 1980. Monetary velocity had been stable until about then. Money growth didn’t generate inflation because monetary velocity fluctuated wildly. Growth in money supply, as measured by M1, was often matched by declines in velocity. The Fed could engineer money growth and inject liquidity into the financial system without creating inflation.
- Inflation pressures are transitory.
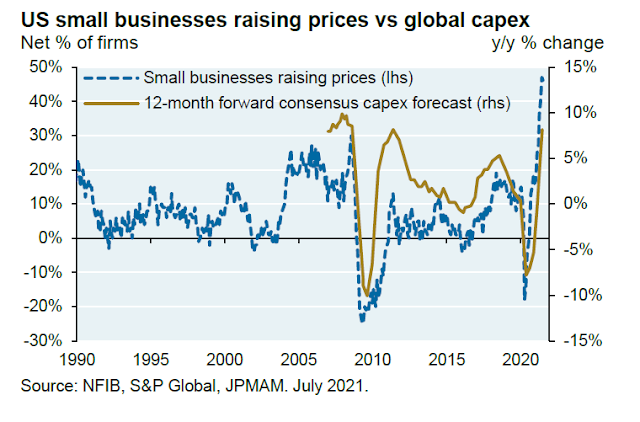
- The economy is embarking on a capital expenditure cycle, which should keep inflation contained.
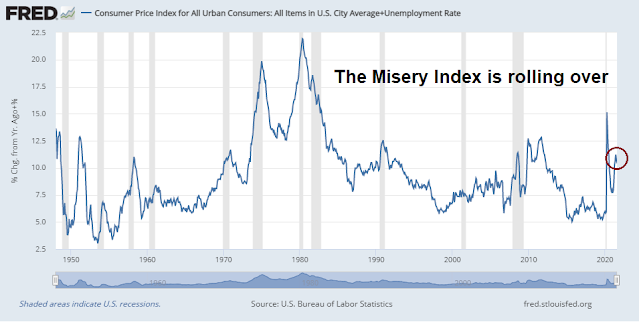
- The Misery Index is tame.
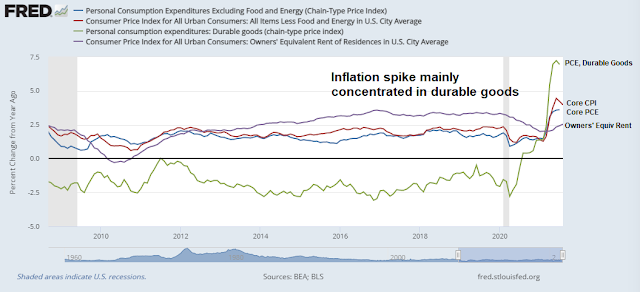
Transitory inflation
One of the world’s biggest shipping lines has decided to stop increasing spot freight rates on routes out of Asia to Europe and the U.S. as it sees an end to the rally that has seen prices hit records.
Hapag-LLoyd AG thinks spot rates have peaked and further increases are “not necessary,” according to Nils Haupt, the Hamburg-based company’s head of corporate communications. The move comes after French rival CMA CGM SA last week froze rates, saying it was prioritizing long-term relationships following a rally that has seen some spot rates jump more than sixfold in the past year.
A new capex cycle
A tame Misery Index
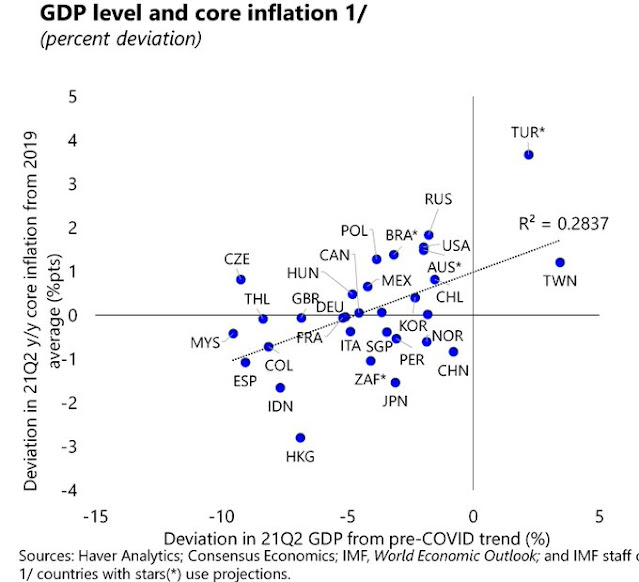
A different source of stagflation risk
It’s also important to keep a historical perspective. Supply chain disruptions are not new, though today’s is more widespread than in the recent past. For example, the earthquake and tsunami that hit Japan in March 2011 disrupted supply chains and risked upward pressures on inflation, as noted by Mohamed A. El-Erian:
Third, the Japanese disasters are not happening in isolation. They add to the supply shock that the global economy already faces due to the uprisings in the Middle East and the related increase in oil prices. As such, the risk of a global macro tipping point cannot, and should not, be ignored.Hawks gonna squawk, people. As with now, the Federal Reserve viewed the supply chain disruption in Japan as a temporary risk to inflation and economic activity in the United States. Accordingly the Fed did not view a change in monetary policy as an appropriate response. The following is from a special section in the staff forecast for the FOMC (now public) on “Economic Effects of the Earthquake in Japan”.Dislocations in Japan resulting from the earthquake are likely to affect foreign economies through three main channels: Diminished Japanese demand for other countries’ exports, lower foreign direct investment and portfolio flows from Japan, and disruptions to cross‐country supply chains. We expect the first two channels to be fairly minor, given that Japan accounts for a relatively small share of trade and investment inflows for most countries, especially outside of Asia. Disruptions to supply chains represent the main concern at present. Some Asian producers, particularly in the high‐tech sector, are highly dependent on intermediate inputs imported from Japan. However, although production in certain firms and sectors is being disrupted, the aggregate results will likely be limited. Many of the Japanese plants that shut down in the aftermath of the earthquake are already back on line, though not yet at full capacity, and there is scope for resourcing to alternative suppliers. All told, we expect the earthquake to shave about ½ percentage point from GDP growth in emerging Asia in the second quarter, with this negative effect unwinding in the second half of 2011 as normalization in activity and Japanese reconstruction increase demand for industrial supplies and capital goods. The effect on GDP growth in the advanced economies is likely to be even smaller, with modest disruptions reported to production of motor vehicles in the United States, Europe, and Canada because of shortages of auto parts from Japan.
We should take today’s disruption as a warning. I heard early in the pandemic someone refer to Covid as our dress rehearsal for climate change. It ain’t looking good. Covid is a global crisis and its toll on human life is crushing. That said, we have a vaccine that works, and we will eventually contain the pandemic enough that we will work around the current economic log jams.
Climate change is a whole different ballgame. No company is going to engineer a cure over the weekend. Complain about the FDA now? Get ready for lots more complaining. Supply chain disruptions will not be the biggest problem we have during climate disasters, but Covid underscores some of the economic costs on the horizon. We are interconnected globally and as result, we are in this together. The answer now is to get vaccines to the world community as fast as possible. The United States should be leading with more great urgency. We are not. Climate change? Good luck with that.
Climate change is a controversial subject in many circles and the pros and cons of the topic are beyond the scope of this publication. Nevertheless, the world has seen an unusual series of heatwaves and floods in 2021 which has been attributed to climate change. Should they continue, these disasters raise the risk of further supply chain disruptions in the years ahead. While conventional triggers of stagflation are under control, a rolling series of inflationary spikes could trigger a period of inflationary volatility and slowing growth. Investors need to be prepared for this risk of stagflation for an unusual source.
The ESG solution
Global ESG assets are on track to exceed $53 trillion by 2025, representing more than a third of the $140.5 trillion in projected total assets under management. A perfect storm created by the pandemic and the green recovery in the U.S., EU and China will likely reveal how ESG can help assess a new set of financial risks and harness capital markets.
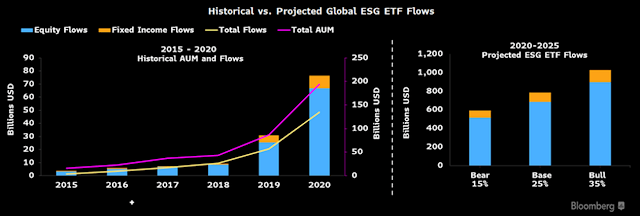
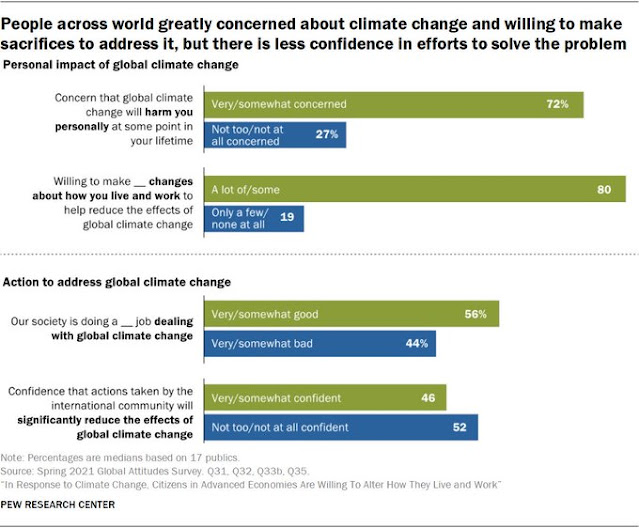
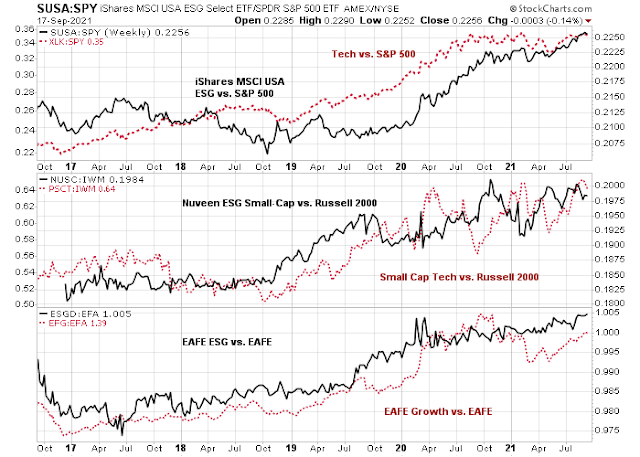
Long innovation, tech and the USA continues to be the formula for best returns at the index level in my view. Broadly overlaps with ESG. Any chance of writing some thoughts on why ‘value investing’ is garbage these days? Too much technological change? Overregulation? Big companies have more mkt power?
On climate change, I am yet to see any beachfront property that has even modestly discounted prices due to climate change risk, and I live on an entire continent of beach front property. Suggests short to medium term risk is negligible.
All good points. Tech is where alpha is, I suppose and hence the skew towards growth/tech investing.
Nothing wrong with growth and innovation, but you have to consider what price you pay for those features.
Just remember the Nifty Fifty era of the 70’s when the narrative was “growth at any price”. It didn’t turn out well then and any similar strategy will suffer a similar fate.
https://www.thestreet.com/etffocus/high-yield-ideas/7-yield-solution-4-etf-portfolio-offers-diversification-risk-mitigation-high-yield
Any insights into these ideas? Need expert opinion.
Thanks, D.V.
I’d be interested in hearing Cam’s take on the four ETFs mentioned.
https://www.etf.com/channels/defined-outcome-etfs?
Several of the four strategies depend on option premiums to enhance the distribution level. They also buy puts to provide downside protection. Here are my comments on the general approach:
1) There is no free lunch
2) The sale of call options limit your upside, unclear what the downside is without a detailed analysis of the portfolio
3) Sure, the puts provide downside protection, but how much? We won’t really know until we get into a bear market.
4) As a general comment, simple buy-write portfolios give up upside for “current income”, but if the PM is forced to continue selling calls in a bear market, the investor never really makes up the bear market loss. The put protection mitigates some of that, but how much?
As for the Dorsey Wright related ETF, you are making a bet on Dorsey Wright strategy, for better or worse.
The MLPs, REITs, BDCs and Closed-end funds strategy depend on the underlying conditions related to these vehicles. Changes in tax regimes and economic conditions could negatively affect these vehicles. Hard to assess.
These vehicles look ok in a bull market, but there is no free lunch and you have to be aware of the risks.
Not to say that I would entirely rule them out. Personally, I own the shares of a pipeline stock that yields 5% plus and I sell covered calls against it. I am well cognizant of the risks of the position but it’s a way of enhancing income in a risk-controlled fashion.
Thanks, Cam.
One of the problems is that the market has been going up with falling interest rates for 40 years. There were big downdrafts in 2000-2002 and 2007-2009, but look at a 50 or 100 year chart. Look at a chart from 1920 to 1966. What would have turned out well from 1932 to 1966 or 1968 would not have worked very well from 1966 to 1982. Selling covered calls is nice in a rising market that consolidates, but when the bear finally comes you can find yourself holding the stock until the call expires during which time you may have lost a lot on the stock…yes you can buy back the covered call and get out…psychologically not easy