Preface: Explaining our market timing models
We maintain several market timing models, each with differing time horizons. The “
Ultimate Market Timing Model” is a long-term market timing model based on the research outlined in our post,
Building the ultimate market timing model. This model tends to generate only a handful of signals each decade.
The
Trend Asset Allocation Model is an asset allocation model that applies trend-following principles based on the inputs of global stock and commodity prices. This model has a shorter time horizon and tends to turn over about 4-6 times a year. The performance and full details of a model portfolio based on the out-of-sample signals of the Trend Model can be found
here.
My inner trader uses a
trading model, which is a blend of price momentum (is the Trend Model becoming more bullish, or bearish?) and overbought/oversold extremes (don’t buy if the trend is overbought, and vice versa). Subscribers receive real-time alerts of model changes, and a hypothetical trading record of the email alerts is updated weekly
here. The hypothetical trading record of the trading model of the real-time alerts that began in March 2016 is shown below.
The latest signals of each model are as follows:
- Ultimate market timing model: Buy equities (Last changed from “sell” on 28-Jul-2023)
- Trend Model signal: Bullish (Last changed from “neutral” on 28-Jul-2023)
- Trading model: Neutral (Last changed from “bullish” on 23-May-2024)
Update schedule: I generally update model readings on my site on weekends. I am also on X/Twitter at @humblestudent. Subscribers receive real-time alerts of trading model changes, and a hypothetical trading record of those email alerts is shown here.
Subscribers can access the latest signal in real time here.
Here comes the Great Rotation
The stock market recently underwent a Great Rotation. Leadership violently rotated from growth to value, and from NASDAQ stocks to small-cap stocks. The reversal was accompanied by a sudden downdraft in the S&P 500.
For investors, the burning question is whether the Great Rotation is a signal for a correction in stock prices.
A crowded long
Arguably, last week’s market action was just the start of a Great Rotation. The violent nature and the magnitude of the move are indicative of a price insensitive short covering. Hedge funds have been increasingly long NASDAQ and short value and Russell 2000 stocks. Fund flow analysis shows that investors have moved to an off-the-charts crowded long in technology. If the rotation were to continue, the unwind has the potential to go much further.
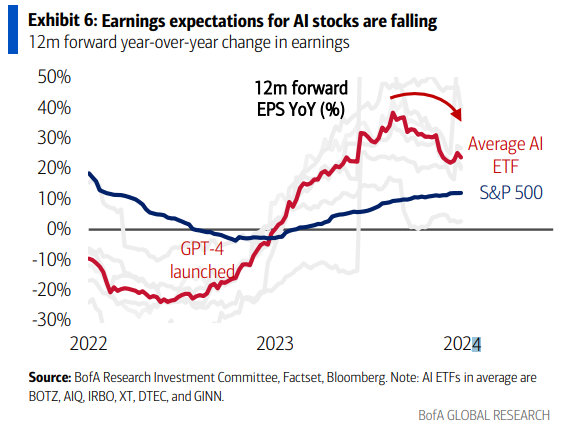
Q2 earnings season is just kicking off. Estimate revision analysis shows that earnings expectations for AI stocks are falling, which could put downward pressure on these stocks and exacerbate the effects of the Great Rotation.
The bull case
Having established a significant reversal is likely underway, the next question is, “What’s the outlook for the S&P 500?”
Here is the short-term bull case. The Great Rotation was accompanied by strong breadth, as evidenced by upside breakouts in different Advance-Decline Lines to all-time highs.
Similarly, the Great Rotation also saw an expansion in NYSE and NASDAQ 52-week highs-lows. Bear markets simply don’t act this way.
While the sample size is small (n=3), SentimenTrader pointed out that seismic shifts in small-cap to large-cap stocks were long lasting.
The bear case
Here is the short-term bear case.
The reversal out of large-cap technology has the potential to be a stampede. The top 10 stocks in the S&P 500, which is dominated by large-cap growth stocks, account for just under 30% of index weight. By contrast, the largest stock in the Russell 2000 has a weight of less than 0.5%. Selling pressure out of the large growth names has the potential to overwhelm the buying pressure from purchases.
The value component of the growth to value rotation consists mostly of cyclical stocks. The consumer discretionary to consumer staples ratio, which is an indicator of risk appetite, is showing few signs of strength, which is potentially a negative sign for equity risk appetite.
The relative performance of defensive sectors is edging up. While the moves aren’t definitive, this is a development to keep an eye on. Further relative strength by defensive sectors could be a warning for stock prices.
In addition, the NYSE McClellan Oscillator (NYMO) and NASDAQ McClellan Oscillator (NAMO) reached overbought conditions and recycled back to neutral, which are tactical sell signals.
The Citi Panic/Euphoria Model is highly euphoric.
Investment implications
So where does that leave us?


Hi Cam,
I’m not sure if I missed something here but in the text you talk about the Consumer Discretionary (RSPD) to the Consumer Staples (RSPS) ratio but in the plot you give the RSPD:RSP ratio. I.e. you are looking at the ratio the Ew Wt SP500 rather than to Consumer Staples.
Looking at the RSPD:RSPS ratio since March 2020 there are a number of broad trends.
1) March 2020 to Nov 2021 => Increasing Ratio
2) Nov 2021 to July 2022 => Decreasing Ratio
3) July 2022 to Dec 2023 => Fairly Steady Ratio
4) Jan 2023 to Now => Its been a bit bumpy but it has generally been in an uptrend
More recently after a steady patch in Mid April to the 3rd week of May there has generally been an increasing ratio.
You are correct. I apologize. The text is wrong. The ratio should be equal weighted Consumer Discretionary to Equal Weighed S&P 500.