The accompanying chart from Jurrien Timmer at Fidelity illustrates my point. If this is a bubble in the making, it could run a lot further as valuation differences are nowhere near the height of the Nifty Fifty or Dot-Com Bubble eras.

The AI bull tires
The AI-driven bull market may be starting to tire as warnings are appearing. Goldman Sachs recently published a prominent research article, “Gen AI: Too Much Spend, Too Little Benefit?”. Goldman argued that the GDP growth benefits from AI implementation will be limited. AI-related capex is too high in light of the lack of a killer application. Moreover, looming power shortages will constrain AI growth.
- The power usage of Generative AI is breaking the power grid;
- Water usage will be another constraint. AI needs plenty of water for semiconductor fabrication, training data sets and cloud services.
- Copyright and Privacy: Large Language Models (LLMs) were made possible by stealing a lot of copyrighted content and private data-like e-mails, word processing documents and spreadsheets stored in the cloud, and so on.
- Security: What are the security vulnerabilities, especially national security, for anyone who uses Generative AI and LLMs?
- How do you deal with toxic uses such as deliberate disinformation, deepfake porn or deepfake scams against the elderly and plagiarism?
Today, the hyperscalers (Amazon, Microsoft, Google, and META) dominate total capex, which creates significant risk if this bubble were to pop.

For the last word, a truly transformative leap in processing may be coming in the form of bioprocessors. See this news report about 16 lab-growth brains running a living computer as a proof of concept of bioprocessing has the promise of truly transforming AI-driven processing:
Swiss technology firm Final Spark has successfully launched Neuroplatform, the world’s first bioprocessing platform where human brain organoids (lab-grown miniaturized versions of organs) perform computational tasks instead of silicon chips.
The first such facility hosts the processing prowess of 16 brain organoids, which the company claims uses a million times less power than their silicon counterparts.

Too early to turn bearish
Despite the warnings, I believe the bull run isn’t over just for a number of macro, fundamental and technical reasons.

The higher-than-expected PPI report didn’t move the inflation needle very much either. Now that both CPI and PPI have reported, most of the components of PCE, the Fed’s preferred inflation metric are known. The Cleveland Fed’s core PCE nowcast for June is now flat, or more precisely -0.01%. It’s an open question whether Powell can convince the hawks on the FOMC at the September meeting is still an open question, but the Fed is on track to cut rates in the near future.

From a valuation perspective, while S&P 500 forward P/E appears excessive, the excesses are concentrated in the largest names. Marketwatch pointed out that while the S&P 500 forward P/E is 21.4, which is near the top of its historical range, its median forward P/E is 17.8, which is just below its 10-year average of 17.9.

As we approach Q2 earnings season, forward 12-month EPS is very strong, which is a sign of positive fundamental momentum.

Few major signs of distribution
From a technical perspective, there are few major signs of distribution. The accompanying breadth chart of the market in 1999 and 2000 illustrates this point. Percentage bullish topped out and began to decline in May 1999, which was well before the NASDAQ top of March 2000. The S&P 500 Advance-Decline Line started diverging from the S&P 500 in mid-1999. Investors saw a warning of a major top when the NASDAQ 52-week highs-lows turned negative mid-March 2000, which was about two weeks before the actual top and technical break.

Consider the breadth outlook today. Percentage bullish has been falling this year, but as the 1999–2000 episode shows, that indicator was very early to signal a top. The S&P 500 A-D Line is only exhibiting a minor breadth divergence; 52-week highs-lows (bottom two panels) are still healthy.

The frenzy in AI-related tech has largely been confined to large-cap stocks and there are few signs of excess in small-cap tech. An analysis of the relative performances of large-cap and small-cap tech shows that small-cap tech stocks have lagged the Russell 2000 for the past year. Moreover, the relative performance of small-cap to large-cap tech parallels the relative performance of the Russell 2000 to the S&P 500 (bottom panel).

In fact, the market may be undergoing a rotation from growth to value. Value started to outperform internally in early June, and it started to turn up recently in the U.S. across all market cap bands. This is what bulls like to see. When one sector falters, another takes up the leadership baton.

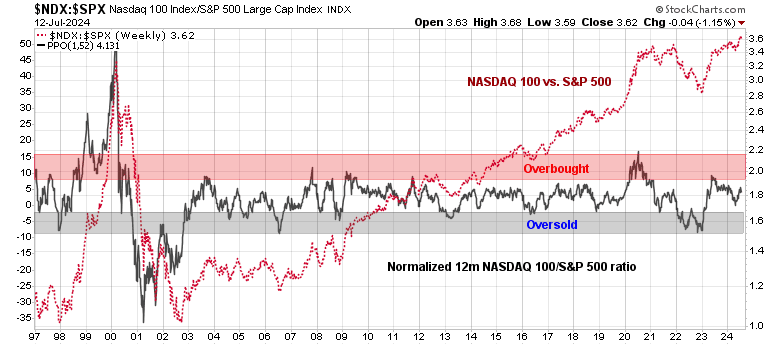
As Q2 earnings season proceeds, investors will be closely watching the reports from the megacap AI names. If there is an AI bubble, it is arguably not over. If history is any guide, the 12-month normalized NASDAQ 100 to S&P 500 ratio (black line) is not even in the overbought zone and could potentially surge further.
In conclusion, valuation and breadth indicators are flashing concerning signs of excesses. I believe this market bull has more room to run. Valuations are stretched but not bubbly. Price and fundamental momentum are strong, and I am not seeing signs of distribution.
Anyone under 50 likely does not remember the1987 crash. David Hunter has been talking of a melt up for over a year. There is no way to predict how rapid a descent this bubble will take when it pops ,except that it will likely be rapid. So longs may not react as fast as AI driven computers and just end up holding a bag.
AI won’t stop. If there is a security threat or race between nations, it won’t stop. You might as well ask the world to demilitarize.
Disinformation will continue. How will it evolve?