Preface: Explaining our market timing models


The latest signals of each model are as follows:
- Ultimate market timing model: Buy equities (Last changed from “sell” on 28-Jul-2023)
- Trend Model signal: Bullish (Last changed from “neutral” on 28-Jul-2023)
- Trading model: Neutral (Last changed from “bullish” on 24-Jan-2024)
Update schedule: I generally update model readings on my site on weekends. I am also on X/Twitter at @humblestudent. Subscribers receive real-time alerts of trading model changes, and a hypothetical trading record of those email alerts is shown here.
Subscribers can access the latest signal in real time here.
NVIDIA’s week
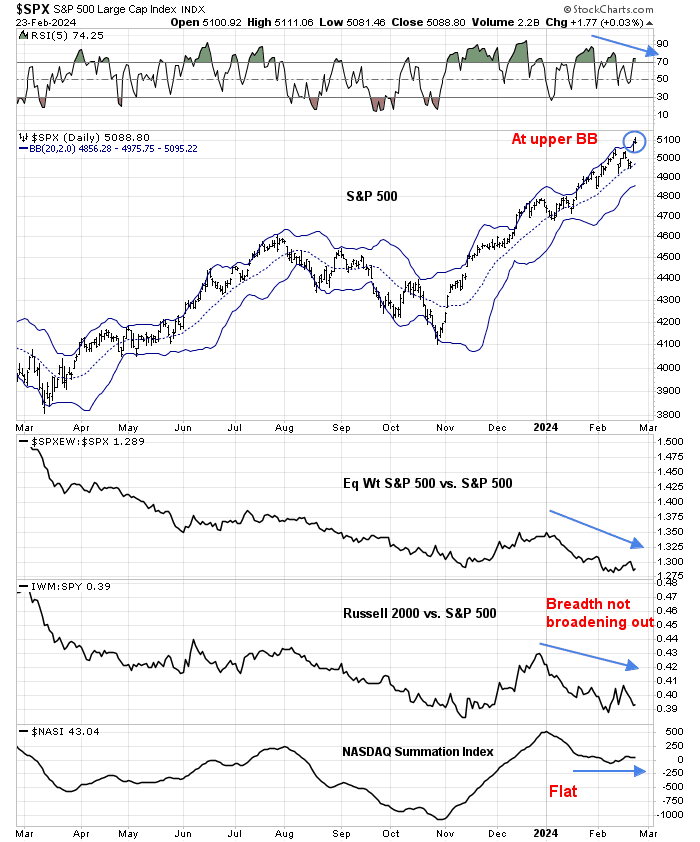
Bullish exhaustion?
The NVIDIA-sparked advance looks exhaustive. Even if we were to ignore the non-technology related parts of the market and focus on the NASDAQ 100, it’s disconcerting that a semiconductor led rally is characterized by short-term NASDAQ 100 underperformance. Moreover, poor relative breadth (bottom two panels) represents another warning of poor internals under the hood.

Equally ominous are the price actions of QQQ and QQQJ, or the juniors. QQQ gapped to a new high on Thursday in the wake of the NVIDIA earnings report, but failed to follow through Friday by pulling back below the breakout. During this same period, QQQJ made a new lower high.

Renaissance Macro Research pointed out that the combination of strong price momentum and extremely bullish positioning in NVIDIA has created a “buyers’ frenzy”. Historically, similar episodes have resolved in either corrections or consolidations.

Jason Goepfert observed that the post-NVIDIA earnings report rally saw the NASDAQ Composite up nearly 3%, but with poor breadth, as measured by fewer than 55% of issues advancing. This has only happened during the 1999–2001 dot-com bubble top period.

The 10 dma of the ratio of NASDAQ to NYSE volume has historically correlated to the NASDAQ 100. But even as the NASDAQ 100 reached fresh highs, relative volume failed to confirm the advance, which is a disconcerting sign of a lack of participation.

The usually reliable S&P 500 Intermediate Breadth Momentum Oscillator (ITBM) recently flashed a buy signal when its 14-day RSI recycled from oversold to neutral — but with a difference. Historically, failures of ITBM buy signals were characterized by near overbought readings, as measured by the percentage of S&P 500 stocks above their 20 dma (bottom panel). This is one of those occasions, which I interpret as limited upside for stock prices.

Respect the trend, but…
I am mindful of the exhibition of price trend and momentum. I also respect the adage that there is nothing more bullish than higher prices. Different varieties of price momentum factor ETFs have all been beating the market recently.

Keep in mind, however, the market was hyper-focused on NVIDIA last week and other news was pushed aside. The FOMC minutes were released. While Fed officials acknowledged that the hiking cycle was over, they also signaled that they are in no hurry to cut rates. Fed Governor Christopher Waller’s speech entitled “What’s the Rush?” last week summarized the Fed’s position well.
So, the data that we have received since my last speech [on January 16] has reinforced my view that we need to verify that the progress on inflation we saw in the last half of 2023 will continue and this means there is no rush to begin cutting interest rates to normalize monetary policy.
He concluded:
The strength of the economy and the recent data we have received on inflation mean it is appropriate to be patient, careful, methodical, deliberative – pick your favorite synonym. Whatever word you pick, they all translate to one idea: What’s the rush?
Any hope of a March cut is gone, and consensus is forming that the first cut will occur in June. The 2-year Treasury yield has been edging up ever since the release of the FOMC minutes, it’s unclear whether the stock market has fully reacted to this higher-for-longer scenario.

In conclusion, the NVIDIA-inspired rally last week was impressive, but poor market internals are pointing to an exhaustive move. The market is in need of a sentiment reset before the next sustainable bull run. While I remain long-term bullish on U.S. equities, traders should be cautious about the near-term outlook as the market can pull back at any time.

The last week has TWISTs in the Hong Kong Index and two in Base Metals. these are complimentary and have been weak. Energy is also stronger which may be due to China waking. I’ve been burned too often in China but the base metals look interesting.
I am switching to virtually only using momentum ETFs. The base metals momentum is PYZ. Energy is PXI. That’s not a recomendation.
There is something about charts that reminds me of Heisenberg Uncertainty..you cannot measure both the position and speed at the same time…you can have one but not both…kinda like having cake.
It strikes me that this applies to market trends and periods. There is terrible noise in small time frames, so trends flip often. This is why some prefer monthly periods, less noise and one can see the trend, but what are we measuring? Price in dollars.
What if we measure price in gold? We are not near the 2000 high. OK the gold bugs are the problem, except, if we measure SPX against doctor copper, we get the same thing, nowhere near the 2000 high.
It’s the dollars stupid! Deficit spending is devaluing the dollar by making more available in the mainstream economy. So what’s going to stop that?
Do I expect deficits to stop? No, I don’t. But what could happen is defaults on debt, the zombie companies etc.
It’s why we have to keep an eye on bond spreads and interest rates.
Yes it is the devaluation of fiats, in other words credit expansion, which drives the return of the markets for the most part. Since you live in Long Beach you probably heard about Shohei Otani’s $700MM contract with Dodgers. If you examine the details of the contract you will immediately notice that it is extremely heavily backend loaded. In other words the people who did the number crunching for Dodgers expect USD to depreciate substantially at 10 years’ end when the big numbers for Otani start to hit. NFL just increased this coming season’s salary cap for each team to be up by $30MM. The average admission price for this Superbowl tops $9K.
That’s why equity market is your best hedge against inflation. It is dynamic and swift in reflecting the money supply reality. Companies are run by people who deal with real world. Together they did the job for you so long as you are patiently staying in the game. I did a little reading and found that the housing prices around where I live have risen at least 200x for the last 60 years, yet the average salary at best rose 10x.