Preface: Explaining our market timing models
We maintain several market timing models, each with differing time horizons. The “
Ultimate Market Timing Model” is a long-term market timing model based on the research outlined in our post,
Building the ultimate market timing model. This model tends to generate only a handful of signals each decade.
The
Trend Asset Allocation Model is an asset allocation model that applies trend-following principles based on the inputs of global stock and commodity prices. This model has a shorter time horizon and tends to turn over about 4-6 times a year. The performance and full details of a model portfolio based on the out-of-sample signals of the Trend Model can be found
here.
My inner trader uses a
trading model, which is a blend of price momentum (is the Trend Model becoming more bullish, or bearish?) and overbought/oversold extremes (don’t buy if the trend is overbought, and vice versa). Subscribers receive real-time alerts of model changes, and a hypothetical trading record of the email alerts is updated weekly
here. The hypothetical trading record of the trading model of the real-time alerts that began in March 2016 is shown below.
The latest signals of each model are as follows:
- Ultimate market timing model: Buy equities (Last changed from “sell” on 28-Jul-2023)
- Trend Model signal: Bullish (Last changed from “neutral” on 28-Jul-2023)
- Trading model: Bullish (Last changed from “neutral” on 20-Nov-2023)
Update schedule: I generally update model readings on my site on weekends. I am also on X/Twitter at @humblestudent. Subscribers receive real-time alerts of trading model changes, and a hypothetical trading record of those email alerts is shown here.
Subscribers can access the latest signal in real time here.
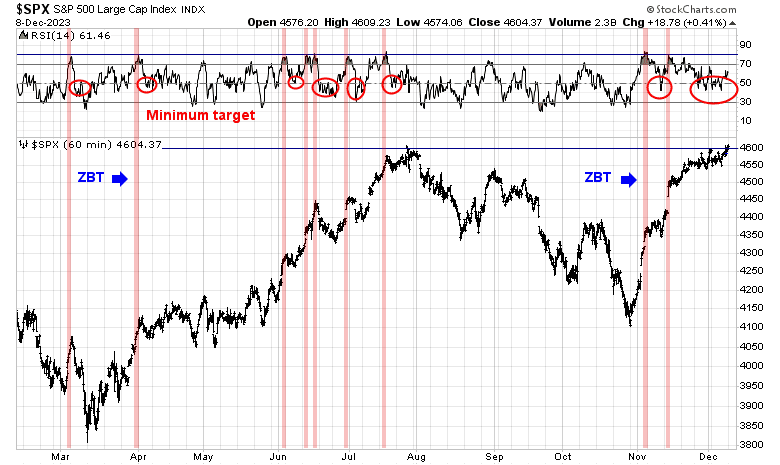
A healthy consolidation
The S&P 500 staged a late Friday breakout above 4600 out of a narrow consolidation range. The accompanying hourly chart shows that whenever the 14-hour RSI reaches an overbought extreme of 90 or more, it has retreated to a minimum level of 50, which it has in the latest episode. In light of the powerful momentum exhibited by the Zweig Breadth Thrust buy signal in early November, the market has met the conditions for another bull run in the near future.
I continue to believe that stocks are poised for a rally into year-end. My analysis of market internals shows that the market’s animal spirits are still alive.
Bullish liquidity sparks animal spirits
Liquidity conditions are supportive of a risk-on tone in asset prices. One quick real-time proxy of liquidity is Bitcoin and other cryptocurrency prices.
Bitcoin prices are also correlated to the relative performance of speculative growth stocks, as measured by the ARK Innovation ETF (ARKK). Current conditions reflect a flood of liquidity and tailwinds for high beta animal spirits’ stocks represented by ARKK.
Supportive positioning
In addition, a recent interview with derivatives analyst Cem Carson also paints the potential for a melt-up into year-end and beyond. Here are the main points from the interview transcript, which is well worth reading in its entirety.
- A flood of yield-enhancing structured products and ETFs that use buy-write strategies of buying an underlying index and selling call options for extra income have served to suppress implied volatility, which creates a price bullish environment.
- The surge in 0DTE option trading, or options that expire the same day, allow banks issuing these structured products to hedge their risk cheaply. 0DTE option trading also suppresses implied volatility.
- These circumstances create an unstable equilibrium, but don’t worry about short-term instability.
- Current positioning of structured products, along with year-end re-positioning, imply strong positive flows into equity-linked products until at least January 3, or possibly January 17, which is VIX expiration.
A separate research note from Charlie McElligott at Nomura is also calling for a year-end melt-up:
That infamous call spread buyer made the jump into Dec 29th 4800/4820 ES and Jan. 5th 4800/4820 CS. Such a jump in short period likely elicit Spot up/Vol up reaction with folks forced to chase into Right Tail
No bull market without bulls
Another supportive factor is a surge of insider buying. This group of “smart investors” have historically been prescient in their market timing.
The inverse of insider activity is AAII sentiment. AAII sentiment is starting to become excessively bullish, but that’s not necessarily contrarian bearish. History shows that elevated AAII bull-bear spreads have not been actionable sell signals.in the past. In other words, you can’t have a bull market without the bulls.
Supportive intermarket signals
Intermarket signals are also flashing green. The S&P 500 has been inversely correlated with the USD, which has weakened below a resistance level. Emerging market currencies (bottom panel) already showed the way in early November by breaking up above a key resistance level.
Both equity and credit market risk appetite indicators are also strong and confirm the strength in equity prices.
Event risks ahead
The key event risks to this bullish scenario are the CPI report next Tuesday and FOMC meeting next Wednesday.


Cem Karsan