Preface: Explaining our market timing models


The latest signals of each model are as follows:
- Ultimate market timing model: Buy equities (Last changed from “sell” on 28-Jul-2023)
- Trend Model signal: Bullish (Last changed from “neutral” on 28-Jul-2023)
- Trading model: Bullish (Last changed from “neutral” on 27-Oct-2023)
Update schedule: I generally update model readings on my site on weekends. I am also on X/Twitter at @humblestudent. Subscribers receive real-time alerts of trading model changes, and a hypothetical trading record of those email alerts is shown here.
Subscribers can access the latest signal in real time here.
A narrow advance
The recent Zweig Breadth Thrust signal should have been unconditionally bullish. This is a rare signal that has only been generated eight times since Marty Zweig first wrote about it in 1986. The stock market has been up 6 and 12 months later after every single signal. In some cases, stocks continue to rise like a runaway freight train. In three instances, which include the buy signal generated in late March, the market rose but pulled back several months later to re-test the buy signal level.

Will narrow leadership and bad breadth sink the latest ZBT buy signal?
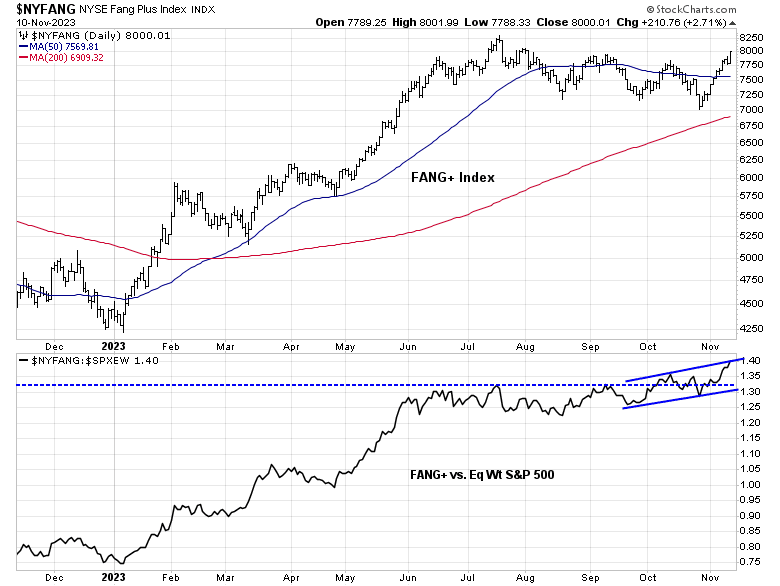
A FANG+ market
Indeed, the NYSE FANG+ Index representing megacap growth stocks staged a relative breakout and has been rising steadily against the equal-weighted S&P 500 (bottom panel).
Further analysis of growth sectors within the S&P 500 shows that technology stocks have staged an upside relative breakout and communication services stocks are in a steady relative uptrend. Only the consumer discretionary sector, which is dominated by heavyweights Amazon and Tesla, has been market performers.

A bad breadth study
Conventional technical analysis focuses on breadth to measure the health of a rally. Using the analogy of an army, investors would like to see a broad-based advance if all the troops (all stocks) are advancing together. A narrow advance consisting of only the generals (large-cap heavyweights) while the troops don’t move is said to be a sign of trouble.

The current market advance is led by the heavyweight megacap growth stocks in the NASDAQ 100. The accompanying chart shows the relative performance of the NASDAQ 100 (red line) and the normalized price momentum of the NASDAQ 100 (black line). Shaded grey zones indicate areas of relative support which would have been good times to overweight NASDAQ 100 stocks.

Poised for a FOMO rally
Sentiment indicators are also supportive of an advance into year-end and beyond. Hedge funds had de-risked to a crowded short just before the ZBT buy signal and they are scrambling to cover their short positions. A recent JPMorgan client survey indicates that the FOMO surge is just starting.

The CNN Business Fear & Greed Index has recovered from levels indicating extreme fear, but readings aren’t even past the neutral 50 level and they aren’t indicating greed.

Option-based sentiment is telling a similar story. The CBOE put/call ratio has normalized from levels indicating panic, but readings don’t indicate complacency.

A breadth warning that works
Do you feel better about the bad breadth problem now?
Instead, here is a long-term breadth waning signal that works. The accompanying chart shows the rolling 52-week average of the difference between the percentage of S&P 100 stocks that are bullish on P&F charts and the percentage of S&P 500 stocks that are bullish on P&F charts. Major market peaks occur when this indicator rolls over from a high level, which is not the case today.

An upside breakout
Looking to the week ahead, the hourly S&P 500 chart shows that its 14-hour RSI reached an overbought extreme reading of 80 and pulled back. Past instances of similar overbought conditions ended when RSI fell to 50 or less. The market reached this level last Thursday and decisively reversed upward by simultaneously rallying above a falling trend line and the 4380-4400 resistance zone. If the history of Zweig Breadth Thrusts is any guide, stock prices should continue to advance, with the next resistance zone at 4500-4540.

Lastly, before anyone freaks out over the late breaking news that Moody’s had downgraded the rating for U.S. debt from stable to negative, remember this April 2020 analysis from
Jason Goepfert of StntimenTrader about past downgrades.

In conclusion, the market action in the wake of the recent Zweig Breadth Thrust buy signal has been characterized by narrow leadership and poor breadth. A historical analysis of market breadth shows that it can take two or more years of negative breadth divergences before a market tops out. Today’s market conditions indicate that the current megacap growth leadership is not extended and can rise much further, indicating more upside potential for both the overall stock market and megacap growth stocks.
I would like to add a note about the disclosure of my trading account after discussions with some readers. I disclose the direction of my trading exposure to indicate any potential conflicts. I use leveraged ETFs because the account is a tax-deferred account that does not allow margin trading and my degree of exposure is a relatively small percentage of the account. It emphatically does not represent an endorsement that you should follow my use of these products to trade their own account. Leverage ETFs have a known decay problem that don’t make the suitable for anything other than short-term trading. You have to determine and be responsible for your own risk tolerance and pain thresholds. Your own mileage will and should vary.
The biggest decision investors have is whether it is time to bargain hunt among the value stocks that have underperformed to an historic degree OR stay with winning growth names. My thought is NO.
Momentum ETFs are doing great for the first time in years. WHY? Before we had stock markets zigzaging in performance from Growth to Value every six months and the momentum ETFs would rebalance into the wrong one. They underperformed for three years because of this.
I bought them a while ago (mentioned in the blog) because I thought this pattern would end and Growth would keep leading and Value lag as the economy decelerated. That is what’s happening. It shows that leaders are staying as leaders. FDMO is therefore doing great. It owns the big cap growth and high quality value.
Ken
What is FDMA?
2. Are you suggesting stay with the momentum trade and don’t buy value?
Sorry, I am finding it hard to follow.
FDMO = Fidelity momentum ETF