Preface: Explaining our market timing models


The latest signals of each model are as follows:
- Ultimate market timing model: Buy equities (Last changed from “sell” on 28-Jul-2023)
- Trend Model signal: Bullish (Last changed from “neutral” on 28-Jul-2023)
- Trading model: Neutral (Last changed from “bearish” on 03-Aug-2023)
Update schedule: I generally update model readings on my site on weekends. I am also on X/Twitter at @humblestudent. Subscribers receive real-time alerts of trading model changes, and a hypothetical trading record of those email alerts is shown here.
Subscribers can access the latest signal in real time here.
Where’s the bottom?
I highlighted how the 5-week RSI of the S&P 500 became extremely overbought. In the past, such instances have resolved with a correction (check), a relief rally (check), followed by a re-test of the correction lows. In three of the last four cases, the second re-test held at the old lows. The only exception was the COVID Crash of 2020, which was panic driven by macro fundamentals. If history is any guide, the next corrective low should terminate at about the site of the August low, which is ~4350.

While my base case is a bottom at about 4350, I nevertheless have to allow for the possibility of a deeper correction. Here’s what I am watching.
Leadership Is lacking
The lack of market leadership makes calling a bottom a difficult task. To be sure, the fever surrounding megacap growth and artificial intelligence has cooled. Last week saw the shares of Apple, which is the largest weight in the S&P 500, hit an air pocket. China announced bans on the use of non-Chinese smartphones in government offices and state companies as a security measure. Staff were instructed not to bring their foreign phones to work, which was a blow to Apple as the company derives about one-fifth of its revenue from China. In addition, the shares of C3.ai hit the skids after it reported earnings that beat expectations. The NYSE FANG+ Index weakened to test its 50 dma, but it remains range-bound relative to the S&P 500 (bottom panel), which is an indication that neither the bulls nor the bears have full control of the tape.

The relative performance of growth sectors revealed few market leadership trends. Technology had pulled back, and communication services and consumer discretionary stocks, which is heavily weighted in AMZN and TSLA, were trendless relative to the S&P 500.

Similarly, the relative performance of value sectors, which are cyclically sensitive, are showing neither leadership nor breakdowns with the exception of energy’s relative strength.

A closer look at the energy sector shows an upside breakout in the sector, but the stocks look extended in the short-term.

When stock prices pulled back that should have been an opportunity for defensive sectors to shine. Instead, they are showing few signs of relative strength, indicating that the bears haven’t seized control of the tape.

Not fearful and not oversold
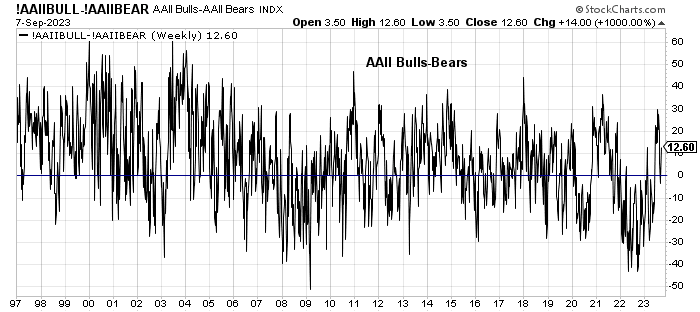
Sentiment models have normalized from bullish extremes, which was contrarian bearish, but readings are not showing excessive bearishness. The weekly AAII bull-bear spread has turned bullish, but readings aren’t extreme.
Similarly, the 21 dma of the ISE Call/Put ratio came down from an extreme bullish level, but readings can only be considered to be neutral.

Conditions are not oversold, which opens the door to further downside risk in light of the negative price momentum exhibited by the market. The NYSE McClellan Oscillator turned down from a near overbought condition but readings are only neutral.

Small-cap stocks have violated key relative support levels (bottom two panels). These breaks could open the market up to further downside and a selling panic.

In summary, a review of market conditions leaves me highly conflicted. Initial S&P 500 can be found at about 4350, with secondary support at about 4200. While the S&P 500 holding at 4350 support is my base case, it could be argued that a lack of extreme fear and oversold conditions opens the door to further downside risk. I would prefer to see relative support broken on either megacap growth or small caps and monitor how market psychology evolves. Under such scenarios will the pullback be orderly, which would be bearish, or panicked, which would be contrarian bullish?

Thinking about money makes my head spin. Bill Gates is worth how much? Well if MSFT goes to zero he is worth a lot less, not that I expect this to happen.
In the old days when currency was based on gold and silver and copper and there was no fractional lending it was easier to follow the money.
So now if the USA wealth is say 60 trillion, based on what? Overpriced real estate , stocks etc. So if things really crash what disappears and what doesn’t? Your house will be there but the bank might take it from you. Your gold will be there but you might not want to sell it for bits of paper so it will be much less liquid.
All of this to ask what happens to stimulus checks, PPP money etc. It seems to me it is like one of those toys where a marble goes tac tac down some slope setting things off…Joe spends his stimulus check at the bar, the bartender pays his rent etc, but doesn’t that money end up in a slower moving stream? Isn’t that what this velocity of money is about? Where will slow moving money go? Bonds, stocks , banks, 401ks?
But if there is a systemic crash where everything drops in value then only debt retains it’s value unless it is defaulted upon either outright or by inflation.
Perhaps the 2% inflation target is to give those in charge the appearance of control. If everything moved by 100, that is wages, price of food, cars etc, what would change? Debt burden would. Affordability would not. A burger might cost 350 bucks but minimum wage would be 1500 an hour and tax brackets shifted.
The problem of course is with the transmission of this inflation, some it hurts more than others.
So my guess is that we are in for more inflation for the foreseeable future because there will be more systemic shocks and whoever is in charge will not allow debt to crush the system. Whether inflation gets out of hand or not, I have no idea but a deflationary regime would likely involve more and more forced liquidation, which would amplify the deflation. We have a lot of debt and most of it I think is not self liquidating.
I should have read yesterday’s post first. My bad
Public debt may or may not be a big problem. It may manifest as an big inflation problem, or not. It depends largely on velocity of M2. And M2 velocity is roughly inversely related to population age. US M2 velocity peaked at 1997 and had small counter-trend local tops at 2000 and 2006. The rest of time it is in a steep and orderly decline. Data traced back to 1959 show a very steady range until 1990. And then from 1990 to 1997 it had a big climb. From 1990 to 2010 US population has a big jump in average age and then steadily increases.
This steady increase of average age has had disproportional decrease in M2 velocity. Our economic growth decelerates roughly with M2 velocity. Yes our national debt level has been rising at a rather fast pace. But as a nation we are more and more conservative in our relationship with money. So inflation may or may not be a big problem outside of those outlying periods like COVID lockdown. I think the last 20 years US has experienced too many large-scale economic downturns in 2000-3, 2008-9 (the biggest one in human history), 2020. Roughly one in every 10 years. This has had traumatic psychological effect on average folks. This fact has exacerbated the aging situation.
Look for the M2 velocity downtrend to continue as our country ages and faces a much more treacherous world. The sense of stability is gradually disappearing. We should be all adjusted mentally to future low-returns in our investment.
Demographics is important. That was Harry Dent’s big thing. But “our” is a big word. Older people may be more conservative with their money, but does Washington spenders consider it our/their money? The demographics point to more and more fiscal deficits.
Japan got away with it I think in large part because it had a positive trade balance for years and no huge military expense.
For many of us, this is not the time to go borrowing and spending, and things do seem less stable, but this could be a feature of getting old.
Cam,
The trading model last changed from bullish to neutral on August 29 per my notes. Thanks!