Preface: Explaining our market timing models
The latest signals of each model are as follows:
- Ultimate market timing model: Sell equities (Last changed from “buy” on 26-Mar-2023)
- Trend Model signal: Neutral (Last changed from “bullish” on 17-Mar-2023)
- Trading model: Neutral (Last changed from “bearish” on 15-Jun-2023)
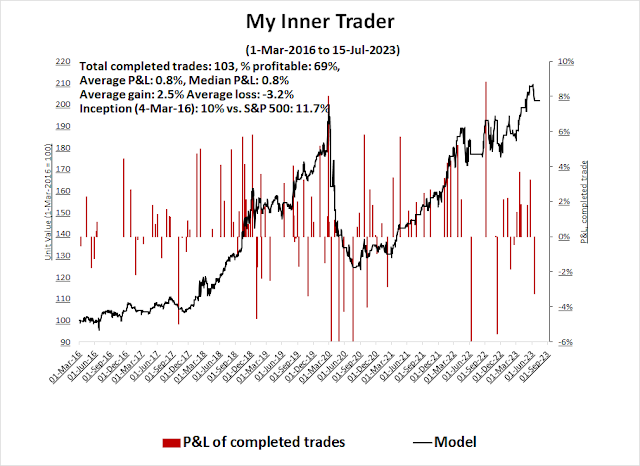
Update schedule: I generally update model readings on my site on weekends. I am also on Twitter at @humblestudent and on Mastodon at @humblestudent@toot.community. Subscribers receive real-time alerts of trading model changes, and a hypothetical trading record of those email alerts is shown here.
Subscribers can access the latest signal in real time here.
A fragile consensus
It’s remarkable how swiftly the consensus narrative can change. Two weeks ago, the 2-year Treasury yield spike above 5% when the ADP Non-farm Employment report came in at a blowout 497K, which was well ahead of expectations of 228K. The news prompted speculation that the Fed would have to tighten more than expected and send the economy into recession.
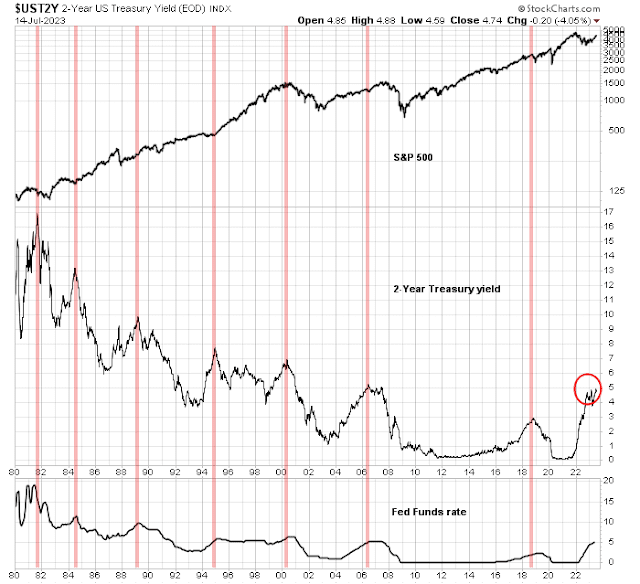
Last week, the softer-than-expected CPI report abruptly shifted the tone of the consensus to a soft landing and sparked a risk-on rally in risk assets and yields retreated. This matters because the 2-year Treasury yield is a proxy for market expectations of the Fed Funds rate. Past peaks in the 2-year rate have either been coincidental or led peaks in Fed Funds.
The current environment illustrates the fragile nature of the market consensus. If the narrative can flip from bear to bull in a week, it may not take much for it to flip back. The market is at a critical juncture. Team Soft Landing is locked in a cage match with Team Slowdown. Who wins?
Team Soft Landing
Here is the case for a soft landing. From a top-down perspective, the U.S. Economic Surprise Index, which measures whether economic indicators are beating or missing expectations, is rising, which is a sign of economic recovery.
The relative returns of selected key cyclical industries are either bottoming or rising.
Even commodity prices have caught a bid.
Team Slowdown
The case for a slowdown relies on leading indicators of economic weakness. The historical record shows that initial jobless claims leads the unemployment rate, and the Sahm Rule, which is a heuristic coined by former Fed economist Claudis Sahm, uses increases in the unemployment rate to spot a recession. Here is a chart of the Sahm Rule (blue line, above 0 is a recession flag) and the 4-week average of initial jobless claims (red line) before the distorting pandemic-related data spike.
Here is a close-up of recent data. We’ve seen five consecutive weeks of warnings of a Sahm Rule recession signal. While these readings don’t represent a definitive recession call, it nevertheless is a sobering warning.
While the soft CPI report is a helpful step in the right direction, it doesn’t move the Fed’s monetary policy needle. We’ve seen these kinds of false starts in the past and the FOMC needs to see more convincing signs that inflation is under control before shifting its policy stance.
The Fed doesn’t want to repeat the stop-start inflation fighting mistakes of the 1970s by declaring victory on inflation too early, only to see inflation run away again. This attitude raises the risk of a policy mistake that overtightens and pushes the economy into recession.
In addition, the growth, value and quality factor return internals of the stock market argue for caution. One way of measuring quality is by profitability. S&P has a stricter index inclusion criterion than FTSE/Russell, which means that S&P stock indices have more profitable companies that Russell ones, which creates a quality bias.
The top panel of the chart shows that while large-cap growth has beaten value in 2023, high quality has performed better. The bottom two panels show that within the value universe, high-quality value outperformed, while within the growth universe low-quality growth was dominant. The combination of low-quality growth and high-quality value leadership tells the story of a frothy market that argues for a tilt toward high-quality value, which is not the characteristic seen during an economic recovery.
A frothy market
Other signs of froth can be found in sentiment indicators. The put/call ratio is showing signs of complacency by recent historical standards, though it could be argued that it’s only normalizing to pre-pandemic level readings.
The NAAIM Exposure Index, which measures the sentiment of RIAs who manage individual investors’ funds, is nearing a bullish extreme.
Tactically, the percentage bullish indicator is in overbought territory. Similar readings in the last two years have resolved in market pullbacks. Overbought markets can become more overbought, but will this time be different?
In conclusion, Team Soft Landing and Team Slowdown are engaged in a cage match. Incoming data in the coming weeks will decide the winner. In the short run, the market is overbought and posed for a period of consolidation or correction.


How much does sentiment reflect confidence? The market is agnostic to us, it is like a sociopath who does not care who loses or wins, which is only normal. But to be a successful con artist, if one is selling something, confidence helps.
So where does this leave Powell? He has to act confident, have some kind of plan (ah yes data driven) that sounds reliable. If he wavers at the next FOMC I think he will not look like a leader. We’ll see.
What Powell has that Burns did not is the history of what happened in the 70s. Burns had the 30s, but in the 30s the dollar was not fiat.
Michael Lebowitz’s recent article on taxes and interest rates argues for a slowing of earnings growth, especially if rates stay up. It’s a headwind, and if the economy slows, it’s worse.
But stocks could still go higher, irrational yes.
In 70s US population is very young, the tendency is inflation (monetary and organic growth). In addition it was an economy influenced by energy prices substantially.
Today US is graying. There is a naturally growing disinflation (if not outright deflation) factor to counter the factor of inflation from money creation. So the direction is not as clear cut. If you don’t create some inflation you will end up with a deflation which is worse. On the economy, it has become much more diversified and data-driven, a more efficient one. So with more experience with data analysis and modeling, we have better tools to manage the money policy. The risk today is mainly from the political side. We have a party which is openly engaged in vote buying with irresponsible fiscal policies. That’s the biggest risk in inflation fighting. UN, IMF, and WB have told Biden Admin to tone it down. Please do not accuse me of being partisan. I am registered as an I, and totally data-driven. I am pretty confident that US has crossed the Rubicon. It is going the way of Rome.
Now we have more and more people voting for their own benefits, and never concerned with who is paying for their freebies. This will cause more people to give up working and join the Enlightened group. Look at France today as an example of future US. Do you think those rioters in France care about a dead teenage delinquent (US equivalent George Floyd)? They want more freebies. That’s the translation. And then the retirement age issue. Do not be surprised France eventually produces a modern-day Napoleon whose rise is totally due to decades’ mob violence and instability in the wake of French Revolution. It is very evident that Europe is going to the Right. Just hope that it is not too extreme. But history shows it will be extreme since the Left has run over the population for so long and so lopsided. The retribution will be just as severe, possibly way more. Grab a drink and enjoy the show. Watch BBC reporters screaming and being attacked on the screen. Promised that it will be non-stop and very entertaining. And if you are a leftist you pray that only getting your head shaved and paraded, like those Nazi collaborators after WWII.
Any thoughts re the following strategy involving a TIPS ladder:
https://www.marketwatch.com/story/beating-the-4-rule-in-retirement-has-become-even-easier-3910be8a?mod=mw_more_headlines