Preface: Explaining our market timing models
We maintain several market timing models, each with differing time horizons. The “
Ultimate Market Timing Model” is a long-term market timing model based on the research outlined in our post,
Building the ultimate market timing model. This model tends to generate only a handful of signals each decade.
The
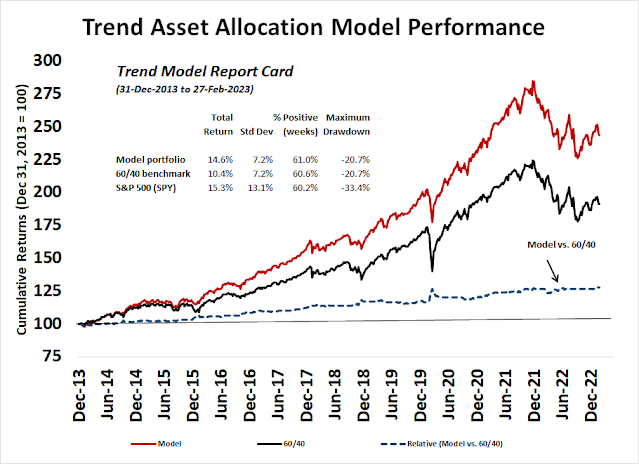
Trend Asset Allocation Model is an asset allocation model that applies trend-following principles based on the inputs of global stock and commodity prices. This model has a shorter time horizon and tends to turn over about 4-6 times a year. The performance and full details of a model portfolio based on the out-of-sample signals of the Trend Model can be found
here.
My inner trader uses a
trading model, which is a blend of price momentum (is the Trend Model becoming more bullish, or bearish?) and overbought/oversold extremes (don’t buy if the trend is overbought, and vice versa). Subscribers receive real-time alerts of model changes, and a hypothetical trading record of the email alerts is updated weekly
here. The hypothetical trading record of the trading
model of the real-time alerts that began in March 2016 is shown below.
The latest signals of each model are as follows:
- Ultimate market timing model: Sell equities [downgrade]
- Trend Model signal: Neutral [downgrade]
- Trading model: Neutral
Update schedule: I generally update model readings on my site on weekends. I am also on Twitter at @humblestudent and on Mastodon at @humblestudent@toot.community. Subscribers receive real-time alerts of trading model changes, and a hypothetical trading record of those email alerts is shown here.
Subscribers can access the latest signal in real time here.
Market stabilization
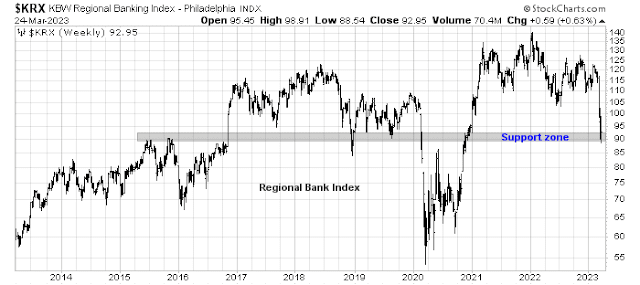
Last week, I suggested that one of the key conditions for a sustainable rally is for the KBW Regional Banking Index (KRX) to hold long-term support despite Friday’s market jitters over the stability of Deutsche Bank. While KRX has held support, it disappointed the bulls by refusing to rally off the bottom. We interpret this to mean that market sentiment over the banking crisis has stabilized.
The Fed Put has been activated, but it’s a put of a different kind. Investors can return to more mundane matters such as technical and fundamental analysis.
Wobbly signs of cyclical strength
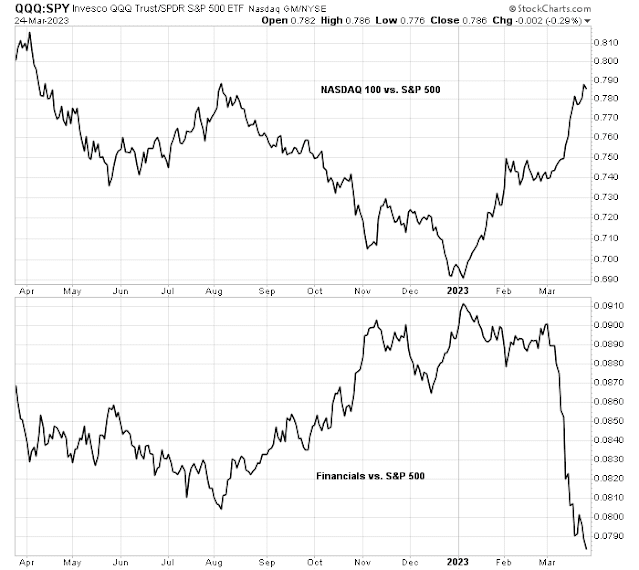
As a framework of analysis, you need to understand that investors rushed into large-cap growth stocks as safe havens during the banking crisis. Since large-cap growth comprise about 40% of S&P 500 weight, any relative performance analysis using the S&P 500 is distorted by the significant weight of growth stocks.
Before the banking crisis, cyclical industries had been in relative uptrends. The same relative performance analysis of the cyclicals reveals a series of broken relative uptrends, with the single exception of semiconductors.
The relative performance analysis of the same cyclical industries against the equal-weighted S&P 500, which reduces the outsized weights of large-cap growth stocks, shows a series of similar patterns of weakness.
The wobbly message from the relative performance of cyclicals is confirmed by a cautionary signal from the softening commodity prices, which should be performing well in light of USD weakness, and weakness in the cyclically sensitive base metal/gold and copper/gold ratios.
Macro and fundamental headwinds
In effect, market conditions have deteriorated since the banking crisis. Not only are cyclical stocks losing momentum, but macro and fundamental analysis called for caution.
The most significant macro headwind was presented by Fed Chair Jerome Powell during the latest post-FOMC press conference. Even though the latest quarter-point hike was interpreted as a dovish hike by the markets, Powell pushed back against market expectations that the Fed would cut rates in 2023 as it was not in the Fed’s baseline. Nevertheless, Fed Funds futures are pricing in a series of rate cuts starting mid-year.
Do you really want to fight the Fed?
In addition, equity valuations is still challenging. The S&P 500 is trading at a forward P/E of 17.2. The last time the 10-year yield was at these levels, the forward P/E was considerably lower, though they were at similar levels in 2003.
When you consider that Street analysts have been downgrading earnings estimates, the forward P/E ratio could be higher even if pries were unchanged. This makes valuation even more challenging for investors.
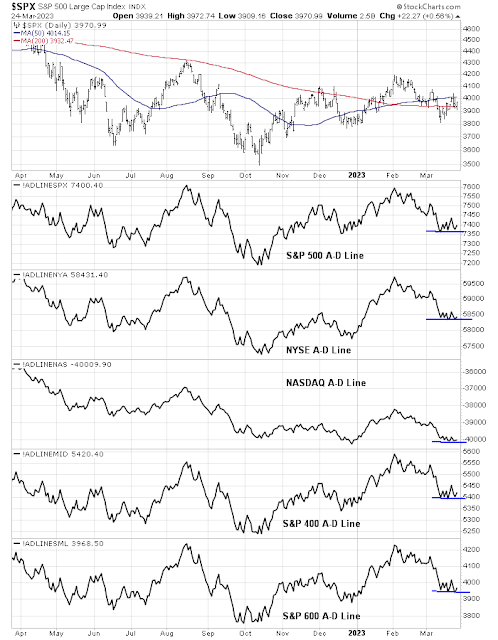
Equally disturbing is the stock market’s poor breadth. Even as the S&P 500 struggles at its 50 and 200 dma, different versions of Advance-Decline Lines are testing support and not showing any signs of strength.
What kind of Fed Put?
I interpret current conditions as Powell Fed has conveyed that there is a limited Fed Put in the market. The Fed will act to support the banking system, or a Bank Put, but it will do little to support the overall stock market, or a Market Put.
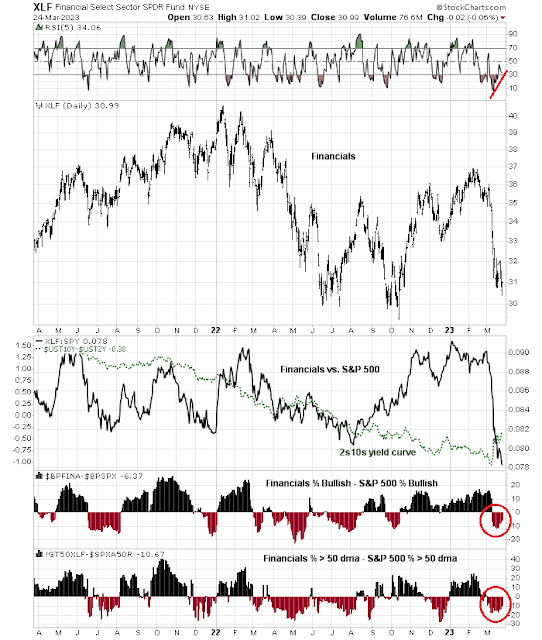
Here’s what the Fed Put looks like. The chart of the financial sector looks ugly, but a bottom may be near. It’s exhibiting a positive 5-day RSI divergence and relative breadth indicators are improving (bottom two panels).
As long as market concerns over the banking system are in place, expect a range-bound choppy market, bounded by about 3800-3830 on the downside and about 4080 to the upside. If 3800-3830 support breaks, the next major support can be found at the 200 wma at about 3740.
As a consequence of these conditions, the Trend Asset Allocation Model reading has been downgraded from bullish to neutral. The Ultimate Market Timing Model is also downgraded to sell as there is a possible recession on the horizon, and recessions are bad news for stocks.My inner investor will start to de-risk and realign his portfolio from an equity overweight to a neutral weight consistent with long-term investment policy weights.
The week ahead
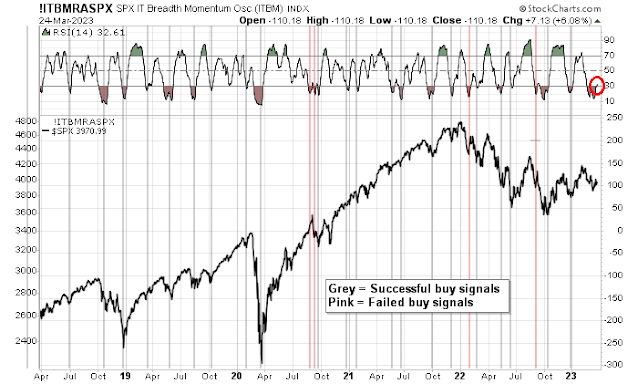
Tactically, the usually reliable S&P 500 Intermediate Term Breadth Momentum Oscillator flashed a buy signal Friday when its 14-day RSI recycled from oversold to neutral on Friday. In the past three years, this model has had 26 buy signals. Of the 26, 22 of them resolved bullishly and four resolved bearishly. My inner trader plans on entering a small long position on Monday/ However, I wouldn’t characterize it as a high confidence trading call in light of the volatile and choppy backdrop.
Helene Meisler’s
weekly sentiment poll readings were cautiously bullish. Respondents have been mostly right about short-term market direction, which makes my inner trader somewhat optimistic.
My inner trader plans on entering a long position on Monday. The usual disclaims apply to my trading positions.
I would like to add a note about the disclosure of my trading account after discussions with some readers. I disclose the direction of my trading exposure to indicate any potential conflicts. I use leveraged ETFs because the account is a tax-deferred account that does not allow margin trading and my degree of exposure is a relatively small percentage of the account. It emphatically does not represent an endorsement that you should follow my use of these products to trade their own account. Leverage ETFs have a known decay problem that don’t make the suitable for anything other than short-term trading. You have to determine and be responsible for your own risk tolerance and pain thresholds. Your own mileage will and should vary.





I had some good news this week. I have been short listed (one of ten) for the Discretionary Portfolio Manager of the Year award in Canada by Wealth Professional Magazine.
Congratulations! Great achievement.
Congratulations Ken. Awesome job !!
Impressive. Congratulations, Ken!
Congratulations! Well-deserved.
Congratulations, Ken!
Thanks all. It’s my privilege to be part of this group of smart, inquisitive investors and respectful people.
All
What are your opinions on the Ten year treasury? This is something that has not been discussed. Would love your thoughts.
Thanks.
I almost missed your post in the middle. My view has been and remains that a recession is likely. Sooner now and probably deeper than pre bank crisis. I have accumulated ten year treasuries to barbell my short term treasuries. If ten year rises to around 3.9 I will add. As it gets to 3.3, I will start peeling off. In the meantime I collect interest.
Thanks. Good approach.
Congrats Ken.
My concern is that we are in a sovereign debt crisis. Not just the USA.
When this happens, fiat gets trashed as it did in Weimar Germany, Zimbabwe etc as a consequence the market goes up.
The Fed is fighting congress. Congress will spend, they want to be re-elected, which fits with the presidential cycles. Does it matter if it is stem-checks or simple fiscal spending so long as the money goes into the general economy? They need a decent excuse though.
How many times have any of us been through a sovereign debt crisis? Well, consider that this is a crisis involving the global reserve currency of the hegemon. OK Rome comes to mind. Europe in the 17th century?
It’s been a while.
If you read Rogoff and Reinhart, apparently inflationary depressions are common.
What’s more we have a democracy where the populace can demand more free stuff once every 4 years if we wish.
Stop fighting the last war.
What happened in the 60s? Well we started to run up these debts, and DeGaulle wanted gold as France was entitled to. What did we do? We closed the gold window. Why? Because Nixon could.
What might they do now? Reopen it? Pull another 1933? It makes me wonder about buying gold, if it will be mandated that I have to give it up. Maybe silver is a better choice. I don’t know, but I would not put anything past them.
Anyone remember the old and new francs in France? I think they went 100 to 1.
So if a new $ is 100 of the old ones and is backed by gold at 200,000 an ounce (which none of us will get to benefit from because it will be similar to 1933, give up your gold, then the rate gets changed). Note I pick 100 times for easy math, and I don’t mean to say this will happen, it’s a “what if” scenario.
Would jewelry be exempt ? Dunno.
Why is Bitcoin so popular? or gold? Why do people fear the IRS? (I do and my taxes are squeaky clean). Is it because deep down we trust the government?
As far as the Fed put/pivot, it’s not what the Fed says, it’s what it does that counts. Recent example, inflation is transient, really?, then when it isn’t we get insane rate hikes.
I have no idea what they will do, but we are in a sovereign debt crisis, we have deglobalization, an aging population which should be deflationary but will require more gov’t largesse (and can vote for it, and that largesse comes with a Cola, not Pepsi or Coca).
My guess is the can gets kicked some more and if inflation goes really high in spite of rates and a recession (remember that inflationary depressions are actually common), then we go back to gold, but it will take a crisis way beyond what any of us have experienced, and our gold will have been taken away from us first.
Will they try price controls? maybe even though that leads to crap.
The IVBC (Venezuelan stock index) in 2020 was around 600 and now is at 29,000. The USA is not Venezuela, but ofc our politicians are so much more honest.
They will tell us and do whatever it takes to stay in power, that is almost a sure thing.
But we are not there yet I hope.
When China opened back in the 80s, did anyone envision the social credit scoring, the cameras everywhere, the monitoring of the internet? Even George Orwell did not, but then this was way before the internet. What Orwell got right was big brother protecting himself, ditto Hunger Games. Human nature does not change, those in power want to stay in power and they do until there is a successful revolution where the old elites are replaced by new elites who are not necessarily better and often worse….Chinese revolution, Russian Revolution, French, Arab Spring.
What makes the American revolution different? It was not of civil war nature, it was a war of independence against an entity on foreign soil, it was not an uprising of Americans against their elites and army. I really hope that does not happen. My point is that whatever happens, there will be elites and those elites will behave according to human nature and want to stay in power.
Now that I have depressed myself, you can join me.
BTW this weekend I shifted back to Investment Winter mode (bear. I have mentioned how the 2022 bear market was a Factor Beta Crash of bubble growth stocks. Normally we have Recessionary Bear Markets with economically sensitive Value stocks leading us to the low. It sermed that Europe avoided a recession, China reopened and America was heading for a no/soft landing. All good for a continuing bull market. Then a bank crisis has hit causing an instant credit crunch setting the stage for a possible hard landing. Value stocks and Small Caps are extremely weak in typical Recessionary Bear mode.
I have a number of bottom marking indicators that I will share next weekend. Of course a TWIST has been a very accurate bottom marker. I am especially watching corporate bond yield spreads particularly CCC Junk.
Congrats Ken, from what you share here I can only guess that it’s very well deserved! Look forward to your insights on which indicators might flash on the bottom.
Thanks so much Ken! Congrats!!
Cam- Your ultimate timing model is described as only having a handful of signals each decade. Yet it has now changed 3 times in last 10 months. Is this period of time that volatile or is possible that your triggers for this model are not as correlated as you’d like? Thanks for any thoughts on this.
This model is the combination of the Trend Model with an economic overlay. Trend following models, e.g. buy or sell the S&P 500 based on the 200 dma, can have a lot of false signals around the MA. So I decided to create an Ultimate Timing Model with an economic overlay. You only exit the market if the Trend Model tells you to AND there is significant recession risk. After that, you allow the Trend Model to tell you when to re-enter the market.
This approach will have a lot fewer signals, but the most recent ones were false positives (nor negatives),
Cam, I appreciate the response. I have read how you’ve built these models multiple times and I love the work. The one area where I have struggled (when it comes to application) is when the Ultimate is at Sell Equities and the Trend Model is Neutral or higher. When this divergence occurs, I struggle with how I might apply this to my allocations. To me it seems that if the Ultimate gives less signals and it is signaling “sell equities” then this would supersede any weighting the trend model is indicating. Thoughts?